Thursday, November 18, 2010

RPy: R from Python (3)


More simple examples from RPy, with an explanation for the failed plot from last time (here).

>>> from rpy2 import robjects
>>> seq = robjects.r['seq']
>>> mean = robjects.r['mean']
>>>
>>> X = seq(1,5)
>>> X
<IntVector - Python:0x100570680 / R:0x1035ab168>
>>> Y = seq(0,2,length=5)
>>> Y
<FloatVector - Python:0x100570638 / R:0x10354ba28>
>>> Z = X + Y
>>> Z
<FloatVector - Python:0x1005707a0 / R:0x1035340a8>
>>> mean(Z)
<FloatVector - Python:0x100570758 / R:0x1034b27a8>
>>> for v in [X,Y,Z]:
... print v
...
[1] 1 2 3 4 5

[1] 0.0 0.5 1.0 1.5 2.0

[1] 1.0 2.0 3.0 4.0 5.0 0.0 0.5 1.0 1.5 2.0

>>> print mean(Z)
[1] 2

Notice that addition is like Python list addition, not numpy or R vector addition. In R:

> X = seq(1,5)
> X
[1] 1 2 3 4 5
> Y = seq(0,2,length=5)
> Y
[1] 0.0 0.5 1.0 1.5 2.0
> Z = X + Y
> Z
[1] 1.0 2.5 4.0 5.5 7.0

Let's look at a classic R-type list:

>>> sqrt = robjects.r['sqrt']
>>> rlist = robjects.r['list']
>>> L = rlist(a=seq(1,3), b='ciao', c=sqrt)
>>> for e in L.iteritems():
... print e
...
('a', <IntVector - Python:0x100572518 / R:0x102ad8208>)
('c', <SignatureTranslatedFunction - Python:0x1005725f0 / R:0x100900030>)
('b', <StrVector - Python:0x100572638 / R:0x100d60f18>)
>>> for i,n in enumerate(L.names):
... print i, n, L[i]
...
0 a [1] 1 2 3

1 c function (x) .Primitive("sqrt")

2 b [1] "ciao"

>>> for e in L:
... print type(e)
...
<class 'rpy2.robjects.vectors.IntVector'>
<class 'rpy2.robjects.functions.SignatureTranslatedFunction'>
<class 'rpy2.robjects.vectors.StrVector'>


>>> cbind = robjects.r['cbind']
>>> # different than R
>>> x = seq(4,1) + seq(2,5)
>>> sample = robjects.r['sample']
>>> y = sample(seq(1,50),8)
>>> x
<IntVector - Python:0x100568cf8 / R:0x1009fb6c8>
>>> y
<IntVector - Python:0x100570ef0 / R:0x1009649b8>
>>> z = cbind(x,y)
>>> z
<Matrix - Python:0x100570cb0 / R:0x10359ec88>
>>> print z
[,1] [,2]
[1,] 4 47
[2,] 3 16
[3,] 2 9
[4,] 1 4
[5,] 2 38
[6,] 3 10
[7,] 4 48
[8,] 5 43

>>>
>>> z.colnames
<RObject - Python:0x100570e18 / R:0x1008dad78>
>>> z.colnames = list('abcdefgh')
Traceback (most recent call last):
File "<stdin>", line 1, in
AttributeError: can't set attribute

Not sure how to do that after the object is created, though we can do it before:

>>> m = cbind(x,y,colnames=list('abcdefgh'),rownames=list('12'))
>>> print m
colnames rownames
[1,] 4 44 "a" "1"
[2,] 3 32 "b" "2"
[3,] 2 9 "c" "1"
[4,] 1 4 "d" "2"
[5,] 2 50 "e" "1"
[6,] 3 8 "f" "2"
[7,] 4 41 "g" "1"
[8,] 5 23 "h" "2"


>>> x
<IntVector - Python:0x100568cf8 / R:0x1009fb6c8>
>>> rsort = robjects.r['sort']
>>> print rsort(x)
[1] 1 2 2 3 3 4 4 5

>>> rorder = robjects.r['order']
>>> print rorder(y)
[1] 4 3 6 2 5 8 1 7

>>> print y
[1] 47 16 9 4 38 10 48 43

sort looks good but order does not.

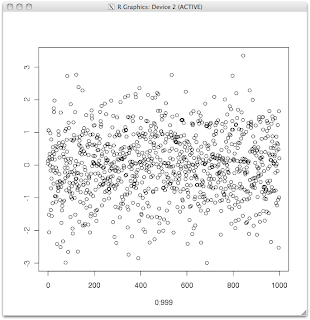
And last, the problem with the plot was simply that in R the y-labels are suppressed, from RPy we have to do it ourselves:

>>> N = 1000
>>> r = robjects.r
>>> x = robjects.IntVector(range(N))
>>> y = r.rnorm(N)
>>> rplot = robjects.r['plot']
>>> rplot(x,y,ylab='')