Thursday, November 4, 2010

R from Python, baby steps


I've been playing around with RPy a bit this morning. As the main page says:
rpy2 is a redesign and rewrite of rpy. It is providing a low-level interface to R, a proposed high-level interface, including wrappers to graphical libraries, as well as R-like structures and functions.

I just used easy_install


$ easy_install rpy2
Searching for rpy2
Reading http://pypi.python.org/simple/rpy2/
Reading http://rpy.sourceforge.net
Best match: rpy2 2.1.7
Downloading http://pypi.python.org/packages/source/r/rpy2/rpy2-2.1.7.tar.gz#md5=e8e8db05f13644ce04784888156af471
Processing rpy2-2.1.7.tar.gz
...

error: /Library/Python/2.6/site-packages/easy-install.pth: Permission denied


For some reason, root was the owner of the .pth file. So I changed it, and then got:


Using /Library/Python/2.6/site-packages/rpy2-2.1.7_20101104-py2.6-macosx-10.6-universal.egg
Processing dependencies for rpy2
Finished processing dependencies for rpy2


The example I chose to run was described in more detail in this post. If we run it from R, it looks like this:


> library(Bolstad)
Warning message:
package 'Bolstad' was built under R version 2.10.1
> result = binobp(68,200,1,1)
Posterior Mean : 0.3415842
Posterior Variance : 0.0011079
Posterior Std. Deviation : 0.0332852

Prob. Quantile
------ ---------
0.005 0.2591665
0.01 0.2666906
0.025 0.2779134
0.05 0.287724
0.5 0.3410604
0.95 0.3972323
0.975 0.4082264
0.99 0.4210788
0.995 0.4298666
> result$mean
[1] 0.3415842
> class(result$mean)
[1] "numeric"
>


In R, the variable result is a list of numeric vectors with names:
$posterior, $likelihood, $prior, $pi (990 elements each), $mean, $var, $sd, $quantiles.

In the Python interpreter:


>>> import rpy2.robjects as robjects
>>> robjects.r['pi'][0]
3.1415926535897931
>>>
>>> from rpy2.robjects.packages import importr
>>> importr('Bolstad')
Warning message:
package 'Bolstad' was built under R version 2.10.1

>>>
>>> binobp = robjects.r['binobp']
>>> result = binobp(68,200,1,1)
Posterior Mean : 0.3415842
Posterior Variance : 0.0011079
Posterior Std. Deviation : 0.0332852

Prob. Quantile
------ ---------
0.005 0.2591665
0.01 0.2666906
0.025 0.2779134
0.05 0.287724
0.5 0.3410604
0.95 0.3972323
0.975 0.4082264
0.99 0.4210788
0.995 0.4298666


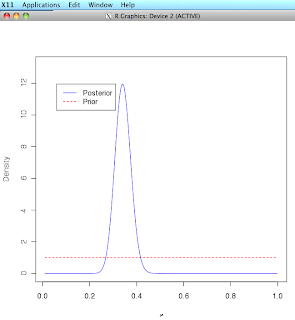
and it opens X11 (rather than Quartz, not sure why) to do the plot. Getting the individual values from the result is a slight pain, but not too bad:


>>> result
<Vector - Python:0x100544290 / R:0x100c6c610>
>>> L = str(result).split('\n')
>>> L[0]
'$posterior'
>>> L[1][:35]
' [1] 1.516820e-80 8.663662e-78 '
>>> result[0][0]
1.5168201745820013e-80


To get the names of the vectors, we need to parse str(result) after splitting on double newlines. If you already know the index of the value you want you can just grab it directly as shown. And of course, that's better, since the value is a float rather than a string.

[UPDATE: As the first comment says, using names is the way to do this. Docs here. And see examples in later posts.]


>>> L = str(result).split('\n\n')
>>> str(L[0]).split('\n')[0]
'$posterior'
>>> str(L[0]).split('\n')[1][:35]
' [1] 1.516820e-80 8.663662e-78 '
>>> str(L[4]).split('\n')[:2]
['$mean', '[1] 0.3415842']
>>> result[4][0]
0.34158415841584161
>>> type(result[4][0])
<type 'float'>