Yesterday was the one-year anniversary of the flag counter widget. We have 144 countries, including a new one: Cote D'Ivoire. It makes me very happy to see all these ≈25K (unique) visitors, even if I don't know that much about them.
From Google's stats, it looks like most people are interested in maybe 25-30 pages. I think there is more good stuff buried here, so perhaps I'll make a post about my favorites one of these days. What I'd love to see, is data that showed a person arriving and then poking around for a while. Sometimes you see a hint of this, but the stats really don't tell that much.
Anyway, thanks for reading! And don't forget to check out the Python book.
And, I'm still waiting for Tonga.
Showing posts with label meta. Show all posts
Showing posts with label meta. Show all posts
Wednesday, February 22, 2012
Saturday, January 21, 2012
Typesetting, again
Here are the equations from the last post, in LaTeX. It took about two hours, fairly painstaking work, but I think it looks pretty good..
UPDATE:
Here is a nice simple reference for LaTeX. I started with "LaTeX Bootcamp" (pdf).
$\mathbf{F} = m\mathbf{a}= m\ddot{\mathbf{r}}
= m\frac{d^2}{dt^2}\mathbf{r}$
$\mathbf{F} = -$$\nabla$$V(\mathbf{r})$
$E = \frac{1}{2}m\norm{\dot{\mathbf{r}}}^2+ V$
$\frac{d}{dt} E = \frac{d}{dt} (\frac{1}{2}m
\norm{\dot{\mathbf{r}}}^2 + V)$
\hspace*{2em}$ = ?$\\
$\norm{\dot{\mathbf{r}}}^2 = \norm{\dot{\mathbf{r}}}
\norm{\dot{\mathbf{r}}} = \dot{\mathbf{r}}
\cdot\dot{\mathbf{r}}$
$\frac{d}{dt}\frac{1}{2}m\norm{\dot{\mathbf{r}}}^2
= \frac{1}{2}m\frac{d}{dt}(\dot{\mathbf{r}}
\cdot\dot{\mathbf{r}})$
\hspace*{2em}$ = m\dot{\mathbf{r}}\cdot
\ddot{\mathbf{r}}$
\hspace*{2em}$ = \dot{\mathbf{r}}\cdot-($
$\nabla$$V$$)$\\
$\nabla$$V$$ = <\frac{\partial{V}} {\partial{x}}, \frac{\partial{V}} {\partial{y}},\frac{\partial{V}} {\partial{z}}>$
$\dot{\mathbf{r}}$ = $<$$\frac{dx}{dt}$, $\frac{dy}{dt}$,$\frac{dz}{dt}$$>$
$\nabla$$V$$\cdot$$\dot{\mathbf{r}}$$=< \frac{\partial{V}} {\partial{x}} \frac{dx}{dt}, \frac{\partial{V}} {\partial{y}} \frac{dy}{dt}, \frac{\partial{V}} {\partial{z}}\frac{dz}{dt}>$
\hspace*{2em}$=\frac{d}{dt}V$\\
$\frac{d}{dt}$E = $\dot{\mathbf{r}}$$\cdot$(-
$\nabla$V ) + $\nabla$V $\cdot$ $\dot{\mathbf{r}}$ = 0
Typesetting math
This post is really just a note to myself about something I need to investigate more. The problem I'd like to solve is how to format mathematical equations for the web. You can see the caveman approach on most of my posts here, like this one.
I just make a table in html
I like the background color, and vary it depending on whether the content is code or output from a program.
It might be nice to have something prettier. So, looking around, I happened across MathJax, and also this post which explains how to use it on Blogger.
Here's a screenshot of the example:
The method used in the post is to load the script from the mathjax server, but I think what I'm probably supposed to do is direct people to resource on my (nonexistent) server. OTOH, they link to the post on the mathjax site.
What I'll probably do is just look into how to use LateX and then post screenshots.
Any thoughts?
I just make a table in html
<div style="overflow-x: scroll;"> <table bgcolor="#ffffb0" border="0" padding="4"> <tbody> <tr><td><pre style="font-family: monaco;"> |
I like the background color, and vary it depending on whether the content is code or output from a program.
It might be nice to have something prettier. So, looking around, I happened across MathJax, and also this post which explains how to use it on Blogger.
Here's a screenshot of the example:
The method used in the post is to load the script from the mathjax server, but I think what I'm probably supposed to do is direct people to resource on my (nonexistent) server. OTOH, they link to the post on the mathjax site.
What I'll probably do is just look into how to use LateX and then post screenshots.
Any thoughts?
Sunday, August 21, 2011
Formatting problem solved
[ UPDATE: So I discovered that the line breaks setting below seems to be retroactive, and changing it messes up the old posts. Another solution is to substitute newlines in the code with <br /> tags. That's what I've done here, and seems OK. This makes it difficult to actually edit code samples in the editor, but them's the breaks. :) ]
On the topic of how to format code samples for the blog, I've been doing some testing and found that the combination of
and
appears to have solved the problems that cropped up (my post here) with my standard approach using <table>. A sample:
On the topic of how to format code samples for the blog, I've been doing some testing and found that the combination of
Settings > Formatting

section:  Convert line breaks

No
and
Settings > Basic

section:  Global > Select post editor

Updated editor
appears to have solved the problems that cropped up (my post here) with my standard approach using <table>. A sample:
def f(n): |
And I like it that the new editor's preview mode gives an accurate view of the product.
However, there are other solutions to consider, including how to get syntax highlighting without needing to load resources that are out of my control (my SO question is here), or whether to use a code hosting service and "embed" the code here. I'll have to get back to you on that.
Sunday, August 14, 2011
Pretty code
[ UPDATE2: In an earlier version of this post, I missed one HTML tag in the code below, as a result the example wouldn't run as described when copy/pasted. Sorry. ]
I've been looking into solutions for posting code on the blog. Since the beginning, I've used
With results looking like a bit like this, but larger :)

I borrowed the technique from Peter Norvig. He's moved on, but I hadn't.
In the last few days Blogger changed something that inserts newlines into such tables. I found another guy who noticed, but no solution. (Perhaps if I used the "new" editor?).
So, I googled around for syntax highlighting. Here is a listing of a bunch of methods. The one I decided to try is google-code-prettify. Like all the methods, it uses javascript and some css to do its work. Instructions are in the readme. The footprint in the html is pretty small, and I like the minimalist style.
To test it, I downloaded the distribution (see the link), and then put a file with the following html in the same directory as the source:
and then drag-n-dropped it on Safari:

One small problem is this note:
Server, what server?
Seriously, I'd be happy to do it, but I don't want to pay Comcast $$ for the privilege.
However, there is a very nice answer on Stack Overflow (here) that shows how to embed the relatively simple css instructions into the html document. Then you just load the code from
I tested it in a simple html document and it worked. Now I'll have to try to incorporate all this into a Blogger template.
[ UPDATE: I see it choked on the
I've been looking into solutions for posting code on the blog. Since the beginning, I've used
<table> tags like this: <div style="overflow-x: scroll ">
<table bgcolor="#ffffb0" border="0" width="100%" padding="4">
<tbody><tr><td><pre style=" hidden;font-family:monaco;">
my code here
</pre></table></div>
With results looking like a bit like this, but larger :)

I borrowed the technique from Peter Norvig. He's moved on, but I hadn't.
In the last few days Blogger changed something that inserts newlines into such tables. I found another guy who noticed, but no solution. (Perhaps if I used the "new" editor?).
So, I googled around for syntax highlighting. Here is a listing of a bunch of methods. The one I decided to try is google-code-prettify. Like all the methods, it uses javascript and some css to do its work. Instructions are in the readme. The footprint in the html is pretty small, and I like the minimalist style.
To test it, I downloaded the distribution (see the link), and then put a file with the following html in the same directory as the source:
<?xml version="1.0" encoding="UTF-8" ?>

<!DOCTYPE html>

<html ... >

.

<head ... >

.

<link href="prettify.css" type="text/css" rel="stylesheet" />

<script type="text/javascript" src="prettify.js"></script>


</head>

<body onload="prettyPrint()">


<pre class="prettyprint" lang-python>

def f(n, s='abc'):

    print 'Hello world!'

    for i in range(n):

        # this is a loop

        print s

</pre>


<pre class="prettyprint">

#include <math.h>

#include "Python.h"


int process (const char *c, double f) {

    int i = 0;

    if (c[0] == 'c') {

        i = floor(f);

    }

    return i;

}

</pre>


</body>

</html>
and then drag-n-dropped it on Safari:

One small problem is this note:
Include the script and stylesheets in your document (you will need to make sure the css and js file are on your server, and adjust the paths in the script and link tag)
Server, what server?
Seriously, I'd be happy to do it, but I don't want to pay Comcast $$ for the privilege.
However, there is a very nice answer on Stack Overflow (here) that shows how to embed the relatively simple css instructions into the html document. Then you just load the code from
http://google-code-prettify.googlecode.com/svn/trunk/src/prettify.js

http://google-code-prettify.googlecode.com/svn/trunk/src/lang-css.js
I tested it in a simple html document and it worked. Now I'll have to try to incorporate all this into a Blogger template.
[ UPDATE: I see it choked on the
<math.h>. I'll have to remember that. ] Saturday, August 13, 2011
Keeping up appearances
Something's changed in blogger that messes with my code examples. The last normal one is from Sat August 6, and the first unusual one is from last Thu August 11. It looks the same as ever in Preview mode, but after publishing, all the code text has acquired an extra newline and is double-spaced.
Code is enclosed within tags:
I liked this method because the output is monospaced, and the background colored according to the type of code (Python, R, output, etc).
I guess I'll have to look into CSS. If anyone has a good set of instructions to point me to, I'd be grateful.
Code is enclosed within tags:
<div style="overflow-x: scroll ">

<table bgcolor="#ffffb0" border="0"

  width="100%" padding="4">

<tbody>

<tr>

<d>

<pre style=" hidden;font-family:monaco;">

..

</pre>

</table>

</div>
I liked this method because the output is monospaced, and the background colored according to the type of code (Python, R, output, etc).
I guess I'll have to look into CSS. If anyone has a good set of instructions to point me to, I'd be grateful.
Friday, May 6, 2011
Flag update
Sunday, March 27, 2011
Flags, detail
A quick note about the flags. There are enough now that it's hard to be sure I got them all. So.. I went to the Flag Counter site (this page, and the next). Rather than do anything fancy, I just copied the text to a file and then processed it with Python. My database of flag images is from Wikipedia, and I shortened the file names by the country code. Since I can't remember a number of them, I wrote a Python script to harvest the Flag Counter entries and match them with the country codes (from here).
I checked the directory with the flag images by eye, which is almost certainly a mistake.
Here is the list of countries from which visitors to this site have come, in alphabetical order. The script is at the end. It shows a number of typical issues you run into with this kind of processing.
I checked the directory with the flag images by eye, which is almost certainly a mistake.
Here is the list of countries from which visitors to this site have come, in alphabetical order. The script is at the end. It shows a number of typical issues you run into with this kind of processing.
AE United Arab Emirates |
from utils import load_data |
Flag update
Thursday, March 10, 2011
Sunday, February 27, 2011
Flag day
Monday, February 21, 2011
One world

wikimedia
I would be somewhat embarrassed if you knew how often I look at the Stats for the blog. See, I'm hoping someone will find it interesting. And I've been very excited recently to discover in my audience what must be new visitors to the site, from Hungary, Poland, New Zealand, Argentina.. I certainly don't remember seeing those before.
So I googled a bit and found Flag Counter. Hope you like it! (Hope it works).
And the story with the flag is this. A long time ago, a friend of mine and I planned (using the word very loosely) that one day we would go to Tonga and set up a (small) research institute. Among other things, we were excited by the fact that the King was a surfer. This idea captured my imagination. So I'm hoping that one day, I will see his flag in the sidebar. Let me know if I miss it.
Sunday, December 5, 2010
CSS and syntax-colored Python for blogspot
Ever since I started posting on blogspot, I've used a standard layout for code fragments and output (also R code) that I originally borrowed from Peter Norvig. (Of course, in the meantime he's moved on).
Now they have a new editor, and it's "recommended", so I tried it on the last post and struggled quite a bit. One problem is that I've been editing the html directly, but the new editor keeps slipping lots of tags in there while I'm working and makes it a pain to see what's going on and where I'm working, etc. In fact, the auto-save feature interrupts an edit to tell me there's no matching tag---for the thing I'm editing right now!
So I want a tool to do the html markup before I get to blogger's editor, then I'll just paste it in there, and back out to the compose tab and work, not worrying about how much weird stuff gets added to the html.
I went looking for syntax-coloring (Python, of course) and found a post about Pygments here. I basically followed those instructions, except that currently the Design tab gives access to a Template Designer, where under Advanced you will find: Add CSS. I used easy_install to get
I edited that to make this addition as the post describes:
and just pasted that into the template. Now I save a code sample I want to color in a file sample.py and do:
Copy that into the edit window flanked by
Now they have a new editor, and it's "recommended", so I tried it on the last post and struggled quite a bit. One problem is that I've been editing the html directly, but the new editor keeps slipping lots of tags in there while I'm working and makes it a pain to see what's going on and where I'm working, etc. In fact, the auto-save feature interrupts an edit to tell me there's no matching tag---for the thing I'm editing right now!
So I want a tool to do the html markup before I get to blogger's editor, then I'll just paste it in there, and back out to the compose tab and work, not worrying about how much weird stuff gets added to the html.
I went looking for syntax-coloring (Python, of course) and found a post about Pygments here. I basically followed those instructions, except that currently the Design tab gives access to a Template Designer, where under Advanced you will find: Add CSS. I used easy_install to get
Pygments (after fixing my .pydistutils.cfg file from this morning). Pygments will spew out a stylesheet with:pygmentize -S default -f html -a "code.syntax" > syntax.cssI edited that to make this addition as the post describes:
code.syntax .hll { background-color: #ffffcc;

display: block;

overflow: auto;

padding: 3px 5px;

margin: 5px 3px;

border: solid 1px #afafaf;

color: #000;

white-space: pre;

}
and just pasted that into the template. Now I save a code sample I want to color in a file sample.py and do:
pygmentize -f html sample.py > sample.htmlCopy that into the edit window flanked by
<b><big>

<code class="syntax"> and </code></big></b>.  It looks like this:
import sys

# this is a sample for Pygment
def f(n):
    try:
        n += 3.14
    except TypeError:
        print 'oops'
    print n

f('my bad')
Wednesday, November 24, 2010
Five Hundred

According to
blogger, I've put up 500 posts over about 2 1/2 years. That's a lot of posts. I've still got much more exploring to do, so I plan to continue talking about it.In the spirit of the day, here is a picture taken earlier in the morning using Photo Booth. As you can see, I'm using only the left half of my brain!
Saturday, November 13, 2010
Correction term for the mean
A few days ago I asked a question on Stack Exchange about the "correction term for the mean" and two different ways of calculating the sum of squares for variance (original post here).
The answer as formulated by Srikant Vadali is developed elegantly in the first link, but recapping with respect to the math, the answer is pretty easy when you know how ;-)
If X is an array of numbers and
written another way:
then expanding the original form of the sum of squares:
But m is a constant so it can move in front of the summation. The second term is then
And the third term is
They add to give
but now we can go back to
and the whole thing is
which was "precisely what was required to be proved." (here)
I think the existence of the family of sites including Stack Exchange and Stack Overflow is just fantastic.
More interesting than my transcription of Srikant's derivation is that his markup looks so much prettier. The source for the first line is
which is obviously not rendering correctly on this page but looks a bit like LaTeX. Anybody know how this is done or how one could do it in Blogger? Time for another question, I guess.
The answer as formulated by Srikant Vadali is developed elegantly in the first link, but recapping with respect to the math, the answer is pretty easy when you know how ;-)
If X is an array of numbers and
n = len(X) |
written another way:
m n = sum(X) |
then expanding the original form of the sum of squares:
sum(X - m)2 = sum( X2 - 2 m X + m2 ) |
But m is a constant so it can move in front of the summation. The second term is then
-sum(2 m X) = -2 m sum(X) |
And the third term is
sum(m2) = m2 n |
They add to give
- m2 n |
but now we can go back to
sum(X):- m sum(X) |
and the whole thing is
sum(X - m)2 = sum(X2) - m sum(X) |
which was "precisely what was required to be proved." (here)
I think the existence of the family of sites including Stack Exchange and Stack Overflow is just fantastic.
More interesting than my transcription of Srikant's derivation is that his markup looks so much prettier. The source for the first line is
$\sum_i(X_i-m)^2 = \sum_i(X_i^2 + m^2 - 2 X_i m)$
which is obviously not rendering correctly on this page but looks a bit like LaTeX. Anybody know how this is done or how one could do it in Blogger? Time for another question, I guess.
Friday, March 26, 2010
Just showin' off

This is a meta-post, a post about the blog. I started nearly two years ago, and I'm still having fun (after more than 400 posts!). I sincerely hope someone else out there in the ether is enjoying it too, or will some day in the future, though I confess to wondering about this from time to time. I have written some posts explicitly for my son, but he doesn't seem to be ready yet.
I appreciate that the eclectic choice of topics is likely to be a distraction for people, but I am pretty impulsive by nature---and I thoroughly enjoy my lack of discipline.
The blog is a way for me to try to record the little bit of understanding that I have gained on some point of interest (usually very recently). I am also stockpiling posts on topics that I plan to provide for students of my bioinformatics class, if the day ever comes when I teach that class again. I guess the main point I'm trying to make now is that I'm enjoying myself, but often feel like I'm broadcasting in a vacuum.
So I was quite surprised to find a very generous comment from Joe Felsenstein here the other day. In fact I went to find my wife so I could brag to her about it. It made me incredibly happy. But I also felt guilty, because I had made a thoughtless negative comment in the post, for which I need to atone.
So here goes...do you feel like Metropolis-Hastings MCMC has the feel of something really, really important, but you don't quite understand it? Me too. While I don't feel totally confident about it yet, I did achieve a kind of mathematical satori about this while reading Chapter 18 in Inferring Phylogenies. For the serious student, his book is the place to start. On this and many other topics. Thank you, Professor Felsenstein.
Sunday, November 1, 2009
eTOCs for Instant Cocoa

Link page for Cocoa Project downloads
link

Heat Mapper
1 2

Pubmed speaks XML
1 2 3 4

Checkbook Project
1 2 3 4 5 6 7 8 9 10

Bar Grapher
1


Color Picker
1 2 3 4 5

Bindings
1 2 3 4 5 6 7 8 9 10 11 12 13 14
Reading and writing data
1 2 3 4 5
Category
1
Document and icons
1
Dragging
1 2
Auxiliary window nib file
1
NSPredicate
NSDate
NSNumber
NSArray
NSView
NSNotification
Wednesday, October 28, 2009
Google Data API - baby steps
The Google Data API is designed to make it easy to get data from Google and use it in your application. I did not find it easy. In fact, I really haven't figured it out yet.
What I want to do is to archive my web log, eventually in an automated way. I'd like to have html for the individual posts, preferably human-readable html similar to what I originally typed in the the editor window. The Atom feed would be perfect since the format is compact. Then I could parse it somehow and go grab the original images from blogger at full resolution. This is important because I haven't kept copies of those images. They're usually just screenshots that I typically discard.
Perhaps I would try to organize everything into directories, say individual posts grouped by months or by topic, and maybe change the image links so they point to the local copies of the images. Ideas:
• Export from Blogger
the XML isn't displayed properly by Safari
• the Atom feed looks nice, but I haven't figured out how to get all the posts at once. This looks like it works, but then you see it's been broken into two pages:
http://telliott99.blogspot.com/feeds/posts/default?max-results=500• The standard URL does work
http://telliott99.blogspot.com/search?max-results=500I can save either of these from Safari as a Web Archive (though that has changed---it is actually in a special Apple format). I can grab the source and save it as HTML, but it's pretty ugly HTML.
Google Data API
This API is designed to make it easy to get data from Google and use it in your application. I did not find it easy but I think I got it working a little bit---baby steps. I would love to find tutorials for this stuff.
I grabbed the Python client library for the Blogger data API and installed as usual. I ran:
./tests/run_data_tests.pyand everything looked fine. I didn't run the sample
BloggerExample.py because the version they have requires a log-in and I didn't want to chance screwing up the blog. By digging in the source to try to change that I just got lost. Eventually I found an introductory video at youtube, but it doesn't go far enough. From the video I learned how to do is this:import gdata.blogger.service,sys |
After a deprecation warning for use of the sha module, I get:
Hidden Markov Models (1) |
I suppose the numbers are ids for the blog and individual posts
So now we need to go farther... After looking more carefully (patiently) at the instructions here, I see that what I'm supposed to do this:
http://www.blogger.com/feeds/profileID/blogsWhere the profileID is obtained from the URL displayed when I click to display my profile.
def test2(): |
This just prints the number of blogs I have!
By reading more in the instructions, I finally got some real data:
def test3(): |
Output from the dir call includes: 'author', 'category', 'content', 'contributor', 'control', 'extension_attributes', 'extension_elements', 'id', 'link', 'published', 'rights', 'source', 'summary', 'text', 'title', 'updated'.
What I need to do:
• Figure out the URL to send to request a particular entry
• Figure out how to work with the xml data format I'm getting
Tuesday, October 27, 2009
The way of the program

You're a scientist---like maybe a biologist. Why should you become a Python coder?

Because the future of Biology is data, and lots of it. Unfortunately, data does not always come in the form you would wish, or that the software you want to use expects. Python's primary purpose is to massage data to get it the way you need it and like it.
And the secret about Python is that it's very easy to use. What you do every day is hard, and you're smart. Python is easy.
Now, if you've never thought at all about how computer programs do what they do, it'll take you a little while to wrap your head around that, a few hours perhaps. But learning to use Python productively is also just a matter of a few hours. An afternoon or two, tops. Can you spare them?
Here's an example. I'm in iTunes,

having just loaded a bunch of songs so that I can put them on an iPod to play in the car. I get to thinking, I wonder if iTunes can export a playlist? Of course it can!
From the File menu do Library > Export Playlist…
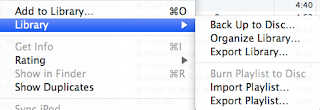

You could bring it up in Word (just kidding) or … How about TextEdit? Just drop the file on the application icon. It looks like this:
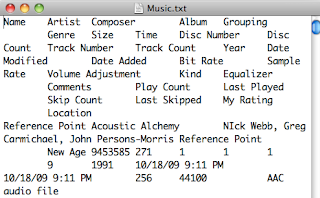
Hmm… lots of what look like they could be columns (because they are separated by what look like they could be tabs). How about Numbers? Drop the same file on that application icon (or Excel, if you insist) and it looks like this:
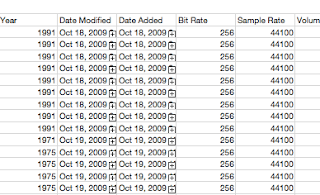
I notice that there is a column that I haven't seen in the playlist, it's called year (year of recording). To make things simpler, select that column in Numbers, then copy and paste it into a new Numbers document. It looks like this:
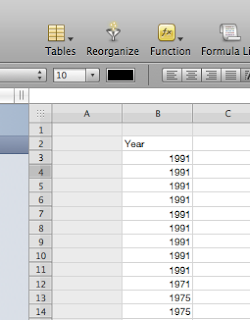
Now what? Numbers can export too. It looks like this:
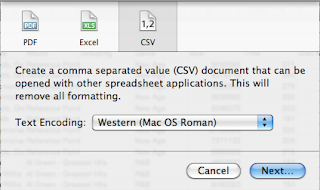
Now bring that file up in TextEdit. It looks like this:
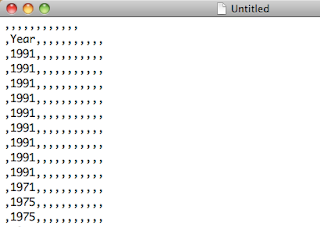
That file sure has a lot of commas in it. Well, sh*t. This is a job for … Python. Put the following in a file called script.py in the same directory as the file with the commas (like your Desktop). I named the file: "fileWithLotsOfCommas", it has a .csv extension if you look using get Info.
The script.py file has:
FH = open('fileWithLotsOfCommas.csv')
data = FH.read()
data = data.replace(',','')
data.strip()
print data
Save it in a file made with TextEdit that is on your Desktop, named script.py. You want plain text. (If you have what looks like this in Text Edit:
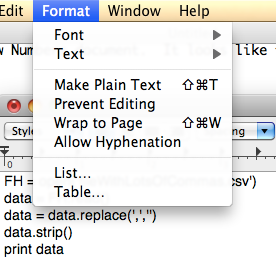
choose the appropriate item from the menu, then do Save.
Now go to the Terminal and do:
python script.py > results.txtThe file looks like this:
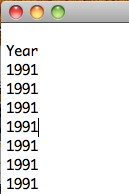
Remove the two lines at the top by hand. Now, you probably don't have R installed yet. But I do. I go to R and do:
setwd('Desktop')
v = read.table('results.txt',head=F)
hist(v[,1], col='magenta',
  breaks=50, xlim=c(1960,2010))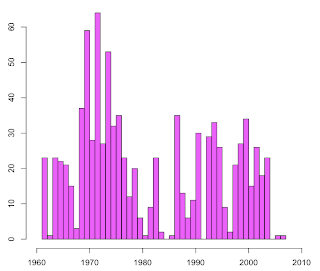
My formula for the user's age: take the first peak and subtract 18.
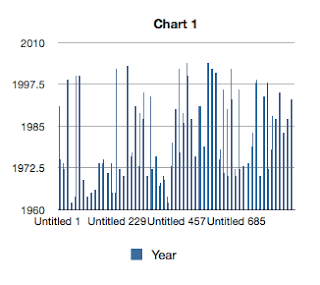
Here is what Numbers gives. It's not nearly so pretty.
Saturday, August 8, 2009
Help Desk
In a previous post I mentioned that I have no idea whether anyone reads my stuff or it is just bits and electrons in the ether, but that's OK because much of it is in the style of "homework" for my self-taught bioinformatics class. Of course, if you are reading and would like to say something, you could sign in and comment (requires a Google account, which is no big deal). Or you can look at my profile, which has a link to my web page at work, and that lists an email address. I'd love to hear from you. With luck I'll be able to distinguish you from a "Nigerian scammer". And if you are actually from Nigeria, and not a scammer, I hope you are not offended by that.
I have had a grand total of 3 comments. I also have 2 "followers" but since they don't show any information, I'm not sure they are real. If you are real, and my habit of only discovering errors after I've published and then correcting them immediately and repeatedly bothers you, let me know.
If you are real, and you have ideas that would improve the presentation, that would be great. For example, I post my code here. I could start an open source project hosted somewhere, but that seems not quite what's required. I looked into adding a "read more" tag, but the instructions got into style sheets and such, and were not all that clear. So remember, the idea is that you might get interested in trying to code some of these problems yourself. My listings are there as a backup. If nothing else, you could run them and look at the output.
Hope to hear from you.
Subscribe to:
Posts (Atom)


