So, I'd been thinking that I'd do the Bioconductor example in Python. The first group of commands in R is:
library('ALL')

data('ALL')

library('limma')
In Python we do:
>>> import rpy2.robjects as robjects

>>> from rpy2.robjects.packages import importr

>>> ALL = importr('ALL')

>>> limma = importr('limma')
and to get the data, we can (cheat a bit and) do
>>> robjects.r('data("ALL")')

<StrVector - Python:0x10eb15a28 / R:0x7f8371183f38>

['ALL']

>>> data = robjects.globalenv['ALL']
The second group of R commands is:
eset <- ALL[,ALL$mol.biol %in% c('BCR/ABL','ALL1/AF4')]

f <- factor(as.character(eset$mol.biol))

design <- model.matrix(~f)

fit <- eBayes(lmFit(eset,design))

sel <- p.adjust(fit$p.value[,2]) < 0.05

esetSel <- eset[sel,]
I figured out how to take apart the data object above, and implement the first line. That was enough to convince me that it's not worth it.
I realized now that the use case is to get the underlying data into and back out of Python. That is, eventually we'll want to learn about how to construct an ExpressionSet object with data starting in Python data structures. But first:
>>> featureNames = robjects.r['featureNames']

>>> fn = featureNames(data)

>>> len(fn)

12625

>>> fn[:5]

<StrVector - Python:0x10eb19ef0 / R:0x7f8371eba940>

['1000_at', '1001_at', '1002_f..., '1003_s..., '1004_at']

>>> fn.rx(1)

<StrVector - Python:0x10eb19440 / R:0x7f8371f85208>

['1000_at']

>>> tuple(fn[:4])

('1000_at', '1001_at', '1002_f_at', '1003_s_at')
That's what we'll want.
The expression data:
>>> exprs = robjects.r['exprs']

>>> ed = exprs(data)

>>> ed

<Matrix - Python:0x10eb10710 / R:0x1137e6000>

[7.597323, 5.046194, 3.900466, ..., 3.095670, 3.342961, 3.842535]

>>> dim = robjects.r['dim']

>>> dim(ed)

<IntVector - Python:0x10eb19cb0 / R:0x7f8372023548>

[   12625,      128]

>>> t = tuple(ed)

>>> t[:2]

(7.597322981163869, 5.046194285620063)

>>> len(t)

1616000

>>> import numpy as np

>>> A = np.array(list(t))

>>> A.shape = tuple(dim(ed))

>>> A.shape

(12625, 128)

>>> A[:5,:3]

array([[ 7.59732298,  5.04619429,  3.90046642],

       [ 5.20211564,  5.81351983,  5.81160593],

       [ 6.14364259,  7.1470674 ,  6.77438247],

       [ 6.76609498,  4.61191719,  4.91830898],

       [ 7.12201406,  7.61231255,  6.82803053]])
The phenotypic data including
mol.biol:
>>> phenoData = robjects.r['phenoData']

>>> pd = phenoData(data)

>>> mb = pd.rx2('mol.biol')

Traceback (most recent call last):

  File "", line 1, in

AttributeError: 'RS4' object has no attribute 'rx2'
UPDATE: this way
>>> slotNames = r['slotNames']

>>> phenoData = r['phenoData']

>>> pd = phenoData(ALL)

>>> slotNames(pd)

<StrVector - Python:0x1023f77a0 / R:0x103140528>

['varMetada..., 'data', 'dimLabels', '.__classV...]

>>>

>>> df = pd.do_slot("data")

>>> df.rx2('sex')

<FactorVector - Python:0x1023e2170 / R:0x10268da40>

[       2,        2,        1, ...,        2,        2, NA_integer_]

>>> mb = df.rx2('mol.biol')

>>> levels(mb)

<StrVector - Python:0x1023e2ea8 / R:0x103742d88>

['ALL1..., 'BCR/..., 'E2A/..., 'NEG', 'NUP-..., 'p15/...]

>>>
pData works:
>>> pData = robjects.r['pData']

>>> pd = pData(data)

>>> mb = pd.rx2('mol.biol')

>>> mb

<FactorVector - Python:0x1154c5cf8 / R:0x7f8374e72010>

[       2,        4,        2, ...,        4,        4,        4]

>>> len(mb)

128

>>> mb.levels

<StrVector - Python:0x1154c5f38 / R:0x7f8371a5c660>

['ALL1..., 'BCR/..., 'E2A/..., 'NEG', 'NUP-..., 'p15/...]

>>> L = list(mb)

>>> L[:5]

[2, 4, 2, 1, 4]

>
Notice how the factor changed into ints (see the Rpy2 docs).
Now, to select the entries we want:
>>> i = mb.levels.index('ALL1/AF4') + 1

>>> j = mb.levels.index('BCR/ABL') + 1

>>> L = [True if e in [i,j] else False for e in L]

>>> sum(L)

47


>>> from rpy2.robjects import BoolVector

>>> bv = BoolVector(L)

>>> robjects.r('f <- function(e,bv) { e[,bv] }')

<SignatureTranslatedFunction - Python:0x1154cf2d8 / R:0x7f8371fa4400>

>>> f = robjects.r['f']

>>> eset = f(data,bv)

>>> dim(eset)

<IntVector - Python:0x1154cf638 / R:0x7f8375052c68>

[   12625,       47]

>>> eset.rclass

<rpy2.rinterface.SexpVector - Python:0x10eb17ee8 / R:0x7f83750f5698>
And that's what we set out to do.
Constructing an R object from data in Python will have to wait.
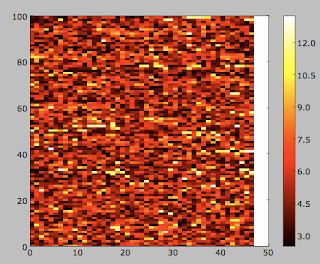
Another look at the selected data:
>>> t = tuple(exprs(eset))

>>> A = np.array(list(t))

>>> A.shape = tuple(dim(eset))

>>> A.shape

(12625, 47)

>>> B = A[:100,]
Might as well plot something while we're here:
>>> fig = plt.figure()

>>> plt.hot()

>>> plt.pcolormesh(B)

<matplotlib.collections.QuadMesh object at 0x10d727610>

>>> plt.colorbar()

<matplotlib.colorbar.Colorbar instance at 0x10d707560>

>>> plt.savefig('example.png')
That is what is at the top of the post.