Sunday, February 27, 2011

Flag day


Here are the flags of the countries of origin for visitors since I put up the flag widget in the sidebar (flags from Wikipedia, apologies for any error).

I tried to cluster them, but couldn't think of a good algorithm :)
colors and symbols I guess.

Thanks for reading!

UPDATE: welcome to:


Qiime (9) shell scripts


This is the README.txt file of a zipped directory on Dropbox (here). It's been tested on OS X and on a Virtual Box running Linux with QIIME (my post here).

The scripts in this directory are intended to simplify the process followed in the Qiime overview tutorial:


http://qiime.sourceforge.net/tutorials/tutorial.html


What they do:

  • download the tutorial files
  • configure the tutorial directory with short paths and file names
  • carry out each step of the workflow scripts individually
  • organize things the way I like it


    They do require that Qiime is already installed, and that the files core.txt and mask.txt be available in ~/data.

    To use this, copy this directory (qiime_shellscripts) to the Desktop.
    Fire up the Terminal and do:


    ~/Desktop/qiime_shellscripts/download.sh


    This script will download the Qiime overview tutorial and unpack it to a new directory qiime_tutorial on your Desktop. On Linux, you will need to substitute wget for curl (or install curl). As things progress, it is likely that you will have to edit the version number in the script. The zipped download remains on the Desktop, so if things get messed up, you won't have to repeat yourself. Then do:


    ~/Desktop/qiime_shellscripts/preliminary.sh


    This will do step 0, splitting the sequences. Next do:


    ~/Desktop/qiime_shellscripts/run_all.sh


    If you wish to re-run the workflow analyses individually, you can first remove results of the previous work with:


    ~/Desktop/qiime_shellscripts/clean.sh


    This last script does not reverse the split step.

    If you need a new copy of this directory, it should still be on Dropbox:


    http://dl.dropbox.com/u/3534458/qiime_shellscripts.zip

  • Saturday, February 26, 2011

    Qiime (8) In the Virtual Box


    We still have more to do in the tutorial, but this post is about the virtual machine with QIIME installed. The website discussion for this is here. My thinking is that for a real 454 or Illumina data set (which I should have at some point in the future), I will want to run "in the cloud." It's all over the web:

    If you need milk, would you buy a cow ?'.


    To do that I will need to get comfortable with Linux and Qiime in this environment. The Qiime website has discussion about the EC2 "image" (here), but for today's example I used the Virtual Box (VB) with Qiime.

    A couple of issues had to be addressed first. There is something called "Guest Additions" that needs to be installed. The way I did it was to do:


    cd /media/VBOXADDITIONS_4.0.4_70112/
    ./autorun.sh


    and then restart the Qiime VB. The second is to train my brain to use


    command (Apple symbol) on OS X
    control when not in the terminal on the Virtual Box
    control-shift when in terminal on the Virtual Box


    And finally, I found the password (qiime---had to search the QIIME Forum for that). The Linux install doesn't have curl so I used:


    wget http://bmf.colorado.edu/QIIME/qiime_tutorial-v1.2.1.zip
    unzip qiime_tutorial-v1.2.1.zip
    rm -r qiime_tutorial-v1.2.1.zip


    Then I just followed my own instructions from here and here. I got a failure with:


    plot_taxa_summary.py:  command not found


    which I fixed by:


    svn co https://qiime.svn.sourceforge.net/svnroot/qiime/trunk Qiime
    cd Qiime
    python setup.py install --install-scripts=/software/qiime-1.2.0-release/bin
    cd tests
    ./all_tests.py


    Failed the following unit tests.
    /home/qiime/Qiime/tests/test_pycogent_backports/test_uclust.py
    /home/qiime/Qiime/tests/test_pyronoise.py

    Failed the following unit tests, in part or whole due to missing external applications.
    Depending on the QIIME features you plan to use, this may not be critical.
    /home/qiime/Qiime/tests/test_identify_chimeric_seqs.py
    /home/qiime/Qiime/tests/test_make_per_library_sff.py
    /home/qiime/Qiime/tests/test_trim_sff_primers.py
    /home/qiime/Qiime/tests/test_workflow.py

    Failed the following script tests.
    /software/qiime-1.2.0-release/bin/process_sra_submission.py


    I'm not too worried about the failures. I'll look into it.
    There's a screenshot at the top of the post. Looking good.

    [ UPDATE: Instructions for shared folders with the host OS here. ]

    Thursday, February 24, 2011

    Qiime (7) Area Plot


    We were plotting a summary chart in QIIME (here). Turns out I just skipped a step:


    summarize_taxa.py -i figs/otu_table.txt -o figs/otu_table_Level3.txt -L 3

    plot_taxa_summary.py -i figs/otu_table_Level3.txt -l Phylum -o figs -k white

    On the stubborn vacuity of the New York Times


    I have nothing to add to this.
    h/t Jonathan Bernstein (here)

    Qiime (6) quick version


    This example is for the impatient (like me): running part 1 of the QIIME tutorial--checklist version.

    [ UPDATE Note: the "workflow script" in the tutorial is actually easier to run than what I have here. It needs only three changes: paths to the Greengenes files (below) and changing the rep set picking method to most_abundant, if desired. This post is about doing the workflow in such a way that the scripts are invoked individually. ]

    Prerequisites (as discussed here and here)
    Install and test:


  • Python 2.6
  • Numpy > 1.3.0
  • PyCogent
  • uclust
  • PyNAST
  • FastTree
  • Java RE (for RDP)
  • RDP Classifier
  • QIIME


    Make sure you have the equivalent of this (some scripts don't seem to look at $PATH):


    > cat ~/.qiime_config 
    qiime_scripts_dir /Users/telliott/bin/qiime/bin


    and that ~/bin/qiime/bin is on your $PATH


    > pick_otus.py -h | head -n 
    Usage: pick_otus.py [options] {-i/--input_seqs_filepath INPUT_SEQS_FILEPATH}


    From the Desktop, get the Greengenes core set data file (38 MB download link). Also get the Greengenes alignment lanemask file (download link). And get the tutorial files (download link), or do:


    curl -O http://bmf.colorado.edu/QIIME/qiime_tutorial-v1.2.0.zip
    tar -xf qiime_tutorial-v1.2.0.zip
    rm -r qiime_tutorial-v1.2.0.zip


    Make some directories:


    mkdir qiime_tutorial/gg
    mkdir qiime_tutorial/figs
    mkdir qiime_tutorial/other


    For the next two steps, if you get an error, recheck the file extensions:


    mv core_set_aligned.fasta.imputed qiime_tutorial/gg/core.txt
    mv lanemask_in_1s_and_0s.txt qiime_tutorial/gg/mask.txt


    I prefer short names, so these directory and file names are different than those in the tutorial.


    cd qiime_tutorial
    mv Fasting_Example.fna data.fna
    mv Fasting_Example.qual data.qual
    mv Fasting_Map.txt map.txt
    mv Fasting_Example.sff.txt other/Fasting_Example.sff.txt
    mv Fasting_Example.sff other/Fasting_Example.sff
    mv qiime_tutorial_commands_parallel.sh other/parallel.sh
    mv qiime_tutorial_commands_serial.sh other/serial.sh
    mv README other/README
    mv custom_parameters.txt other/custom.txt

    > ls
    data.fna figs map.txt
    data.qual gg other


    Step 0:

    split_libraries.py -f data.fna -m map.txt -q data.qual -o split
    mv data.fna other/data.fna
    mv data.qual other/data.qual
    cp split/seqs.fna seqs.fna


    At this point, you could make a backup (including the huge core.txt):

    cp -r ../qiime_tutorial ../qiime_tutorial_backup


    Analysis:


    pick_otus.py -i seqs.fna -m uclust -s 0.97 -o otus
    pick_rep_set.py -f seqs.fna -i otus/seqs_otus.txt -m most_abundant -o otus/reps.txt
    align_seqs.py -i otus/reps.txt -m pynast -t gg/core.txt -o aln
    assign_taxonomy.py -i otus/reps.txt -m rdp -o tax
    filter_alignment.py -i aln/reps_aligned.txt -m gg/mask.txt -o aln2
    make_phylogeny.py -i aln2/reps_aligned_pfiltered.fasta -o tree.tre
    make_otu_table.py -i otus/seqs_otus.txt -t tax/reps_tax_assignments.txt -o figs/otu_table.txt


    Rather than do another heatmap, I thought I'd show a summary area chart


    plot_taxa_summary.py -i figs/otu_table.txt -l Phylum -o figs -k white


    Unfortunately, it's not what we want (the graphic at top seems to be plotting the individual OTUs rather than Phyla). The example in the tutorial uses otu_table_Level3.txt

    I don't see an option for controlling the level of output in make_otu_table.py. I'll have to investigate how to do that. Perhaps if we follow the workflow script it will turn out correctly.
  • Tuesday, February 22, 2011

    Qiime (5) alpha diversity

    Continuing with the exploration of QIIME (earlier posts: one two three four).

    We're following the overview tuturial (here), which has four main parts. There are the three big sections of custom_parameters.txt:


  • picking and analysis of species/OTUs
  • analysis of alpha diversity
  • analysis of beta diversity

    plus

  • a suite of data visualization programs


    Today we're thinking about alpha diversity (within sample diversity). Goals of diversity analysis (using 16S rRNA sequences in bacteria) include measurement of:


  • observed species/OTU richness
  • population distribution among species/OTUs
  • phylogenetic diversity among OTUs


    where OTUs can be defined at different thresholds of sequence identity.

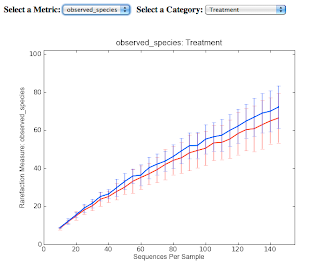
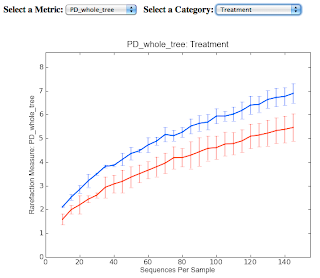
    For this post, I've got screenshots of two graphics produced from the Qiime tutorial analysis of alpha diversity. Consider the first graphic, which plots observed species in two different samples as a function of the number of individual sequences examined. Because chance influences the order in which samples are obtained, resampling techniques are used to generate a rarefaction curve that averages the results of many random samplings of the observed data. Perhaps more important, it allows normalization for the number of samples observed, allowing comparison of samples with different sizes.

    These plots are rarefaction curves.


    The most important questions are probably these two:

    (1) If we could sample exhaustively, what would be the final species count (or phylogenetic distribution or.. ). In other words, does the curve level off, and what is the asymptotic value?

    (2) Can we decide whether two different populations differ significantly even without exhaustive sampling?

    I do not know much about this area, so I should probably just be quiet at this point, but I have to say that I am suspicious that the first question does not always have a good answer (even if people would wish for one). The problem is that the shape of the curve as it goes out into high number of samples does not necessarily depend on the shape at lower numbers. It might do so, if the population structure is not too skewed. But no one can say in advance whether that is true or not.

    Anyway, we follow the tutorial. First remake (and this time, save) the otu_table:


    make_otu_table.py -i otus/seqs_otus.txt -t tax/reps_tax_assignments.txt -o figs/otu_table.txt


    We'll use the workflow script (I don't see too much of interest after a cursory look at the intermediate steps). We can get the required options with -h (help):


    > alpha_rarefaction.py -h
    ..
    REQUIRED options:
    The following options must be provided under all circumstances.

    -i OTU_TABLE_FP, --otu_table_fp=OTU_TABLE_FP
    the input otu table [REQUIRED]
    -m MAPPING_FP, --mapping_fp=MAPPING_FP
    path to the mapping file [REQUIRED]
    -o OUTPUT_DIR, --output_dir=OUTPUT_DIR
    the output directory [REQUIRED]
    -p PARAMETER_FP, --parameter_fp=PARAMETER_FP
    path to the parameter file [REQUIRED]


    What we actually run is:

    command:

    alpha_rarefaction.py -i figs/otu_table.txt -m map.txt -o rare/ -p custom_parameters.txt -t figs/tree.tre -f


    The default settings in custom_parameters.txt are fine for this.

    If you do want to run each of the steps individually, I suggest you run the workflow script, then the log file in will contain a history of the commands that were executed:


    # Alpha rarefaction command 
    python /Users/telliott/bin/qiime/bin/multiple_rarefactions.py -i figs/otu_table.txt -m 10 -x 148 -s 13 -o rare//rarefaction/ --num-reps 5

    # Alpha diversity on rarefied OTU tables command
    python /Users/telliott/bin/qiime/bin/alpha_diversity.py -i rare//rarefaction/ -o rare//alpha_div/ -t figs/tree.tre --metrics chao1,observed_species,PD_whole_tree

    # Collate alpha command
    python /Users/telliott/bin/qiime/bin/collate_alpha.py -i rare//alpha_div/ -o rare//alpha_div_collated/

    # Rarefaction plot: All metrics command
    python /Users/telliott/bin/qiime/bin/make_rarefaction_plots.py -i rare//alpha_div_collated/ -m map.txt -o rare//alpha_rarefaction_plots/ --background_color white --resolution 75 --imagetype png


    The second graphic shows that considering phylogenetic diversity may reveal significant differences that are not seen when just counting OTUs.


  • Fetching sequences from NCBI

    Here's the problem I want to solve:

    I need to collect sequences from NCBI for a small database of 16S rRNA gene sequences from bacteria of interest. Many of these are from clonal isolates so the FASTA-formatted sequences have title lines like


    >gi|29290057|gb|AY207063.1| Abiotrophia sp. oral clone P4PA_155 P1 16S ribosomal RNA gene, partial sequence


    I can parse that title, or I also have the Genbank identifier in a database entry like this:


    AY207063.1     Abiotrophia_clone_P4PA_155


    I grab the corresponding sequence using PyCogent (as discussed in the post here):


    from cogent.db.ncbi import EFetch
    ef = EFetch(id='AY207063')
    print ef.read()


    > python fetch.py 
    >gi|29290057|gb|AY207063.1| Abiotrophia sp. oral clone P4PA_155 P1 16S ribosomal RNA gene, partial sequence
    GACGAACGCTGGCGGTGTGCCTAATACATGCAAGTCGAACGAACCGCGACTAGGTGCTTGCACTTGGTCA
    ..


    However, I also want to get some rRNA sequences from genome projects. In that case the FASTA-formated RefSeq record is huge, and I just want a small part of it.

    From the prokaryote genome projects page at NCBI, I click on the RefSeq link for E. coli MG1655, and on the RefSeq page I click on Structural RNAs

    I find what I'm looking for halfway down the page:

    16S ribosomal RNA of rrnB operon

    I copy the link for "DNA region in flatfile format" (the green diamond)


    http://www.ncbi.nlm.nih.gov/nuccore/NC_000913?from=4164682&to=4166223


    I tried feeding the range information (from and to) to EFetch but got nowhere. And I'm not sure if this is the best way, but here is what I did. I browsed through


    class EFetch(UrlGetter) in
    /Library/Python/2.6/site-packages/cogent/db/ncbi.py

    class UrlGetter(object) in
    /Library/Python/2.6/site-packages/cogent/db/util.py


    I just added a couple of keys to the dict which is used to construct the url. In cogent.utils.ncbi after line 133 I inserted:


            'from', 'to',


    Now this works:


    from cogent.db.ncbi import EFetch
    D = {'id':'NC_000913','from':'4164682','to':'4166223'}
    ef = EFetch(**D)
    print str(ef) + '\n'
    print ef.read()


    > python fetch.py 
    http://www.ncbi.nlm.nih.gov/entrez/eutils/efetch.fcgi?retmax=100&from=4164682&retmode=text&tool=PyCogent&db=nucleotide&email=Michael.Robeson%40colorado.edu&to=4166223&rettype=fasta&retstart=0&id=NC_000913

    >gi|49175990:4164682-4166223 Escherichia coli str. K-12 substr. MG1655 chromosome, complete genome
    AAATTGAAGAGTTTGATCATGGCTCAGATTGAACGCTGGCGGCAGGCCTAACACATGCAAGTCGAACGGT
    ..


    Genbank is smart enough to figure out that the id we sent is not a real gi but refers to a record in the RefSeq database. Rather than using from and to, you'd think it would be OK to use something like:


    NC_000913:4164682-4166223


    but I couldn't get it past EFetch, even with URL encodings. Guess I should run this by the PyCogent crew for issues. Maybe they'll want to put it in the toolkit.

    Monday, February 21, 2011

    One world


    wikimedia

    I would be somewhat embarrassed if you knew how often I look at the Stats for the blog. See, I'm hoping someone will find it interesting. And I've been very excited recently to discover in my audience what must be new visitors to the site, from Hungary, Poland, New Zealand, Argentina.. I certainly don't remember seeing those before.

    So I googled a bit and found Flag Counter. Hope you like it! (Hope it works).

    And the story with the flag is this. A long time ago, a friend of mine and I planned (using the word very loosely) that one day we would go to Tonga and set up a (small) research institute. Among other things, we were excited by the fact that the King was a surfer. This idea captured my imagination. So I'm hoping that one day, I will see his flag in the sidebar. Let me know if I miss it.

    Qiime (4) PyNAST

    Today I've been on a side-track from the QIIME pipeline (or toolkit), related to the construction of multiple sequence alignments (MSA). The favored approach in QIIME is that of NAST (DeSantis et al. 2006 PMID 16845035) as reimplemented in PyNAST using Python (Caporaso et al. 2010 PMID 19914921).

    The fundamental problem with MSA is that it scales very poorly. Analysis of the complexity is itself complex (see the discussion in Edgar 2004 PMID 15318951), but Edgar gives it as O(N4 + L2) overall (N sequences of typical length L). Though of similar complexity, MUSCLE is significantly faster. Still, it grinds quite slowly when you have a lot of sequences (say, > 500).

    From the first MUSCLE paper:


    In agreement with other studies, [e.g. Katoh et al. (8)], we found that T-Coffee was unable to align more than approximately 102 sequences of typical length on a current desktop computer. CLUSTALW was able to align a few hundred sequences, with a practical limit around N = 103 where CPU time begins to scale approximately as N4. The largest set had 5000 sequences of average length 350. MUSCLE-p completed this test in 7 min, compared with 10 min for FFTNS1; we estimate that CLUSTALW would need approximately 1 year.


    NAST (Nearest Alignment Space Termination) is one solution to this problem. The basic idea is simple: use an existing multiple sequence alignment as a framework against which to align new sequences. The trick is that addition of a new sequence will not change the length of the MSA. Besides the algorithm, which we'll talk about, a significant part of the effort going into NAST has been the construction of a large, curated database of high quality bacterial and archaeal 16S rRNA sequences.

    The implementation has these steps:

    • identify the best matching sequence to the candidate in the MSA database
    • trim the candidate and do a global alignment to this best match
    • resolve positions where the alignment introduces a gap into the template

    The example from DeSantis et al is below (T = template; C = candidate). I've shown the template spaces as underlines to distinguish them from alignment gaps:


    T:  ATAC_____GTA_AC____GTA___C___G_T_AC_GG


    Collapse the template spacing:


    T:  ATACGTAACGTACGTACGG
    C: CACGTTAAACGTCGTACCCGG


    Construct the pairwise alignment


    T:  ATACGT-A-ACGTACGTAC--GG
    C: C-ACGTTAAACGT-CGTACCCGG


    Re-introduce template spacing


                   *                         *
    T: ATAC_____GT-A-AC____GTA___C___G_T_AC--GG
    C: C-AC_____GTTAAAC____GT-___C___G_T_ACCCGG


    If you look at the template in the pairwise alignment you will see four positions containing introduced gap characters. Two of these can be accomodated by gaps in the original template spacing, and two cannot (marked with *). These will have to go.

    The * positions must be collapsed to maintain the constant length MSA. In the case of the first one, the aligned GT to its left is displaced. In the second one, the gap between T_A in the candidate is consumed. The final result is:


    T:  ATAC_____GT-AAC____GTA___C___G_T_AC_GG
    C: C-AC____GTTAAAC____GT-___C___G_TACCCGG


    Note that in both cases, a mismatch was accepted in order to repair the gap. This is the weakness of the NAST approach.

    The template may not look exactly the same as when it started, but this difference is not propagated to the database.

    We obtained two files from Greengenes following the Qiime tutorial (my post here). The first is a "core_set":


    >>> FH = open('core_set_aligned.fasta.imputed.txt')
    >>> data = FH.read().strip()
    >>> FH.close()
    >>> data.count('>')
    4938
    >>> first = data.split('>')[1].strip().split('\n',1)[1]
    >>> len(first)
    7682


    It contains nearly five thousand high quality 16S ribosomal RNA gene sequences that have been aligned. Each one of those sequences consists mostly of '-' gap characters. Almost all of those positions are gaps in every single sequence. These are indexed using the "lane mask":


    >>> FH = open('lanemask_in_1s_and_0s.txt')
    >>> mask = FH.read().strip()
    >>> FH.close()
    >>> len(mask)
    7682
    >>> mask.count('0')
    6395
    >>> mask.count('1')
    1287
    >>> L = [c for c,m in zip(first,mask) if m == '1']
    >>> print ''.join(L)
    >>> print ''.join(L)[:50]
    ATTGAACGCTGGCGGTATGCTTAACACATGCAAGTCGAACG-AGTGGCGG
    >>> len(L)
    1287


    Naturally, the "core_set" is a large file


    >>> data.count('>')*len(mask)
    37933716

    > ls -l core_set_aligned.fasta.imputed.txt
    -rw-r--r--@ 1 telliott staff 37975992 Feb 19 06:07 core_set_aligned.fasta.imputed.txt


    I made some fake data to run through pynast:


    >0 A
    GAGTTTGATCCTGGCTCAGATTGAACGCTGGCGGTATGCTT
    >1 B
    AGTTTGATCCTGGCTCAGATTGAACGCTGGCGGTATGCTT
    >2 C
    GAGGATCCTGGCTCAGATTGAACGCTGGCGGTATGCTT
    >3 D
    CCCGAGGATCCTGGCTCAGATTGAACGCTGGCGGTATGCTT


    Sequence B is the same as A, but missing the first nt, C is missing the first 6 nt, and D has a substitution for the first 6 nt.

    The template looks like this:


    >Y
    GAGTTT-GA--T-CC-T-G-GCTC-AG-AT-TGAA-C-GC--TGG-C--G-GT-A-TG--C----T-T
    >Z
    gagttt-ga--t-cc-t-g-gctc-ag-at-tgaa-c-gc--tgg-c--g-gc-a-gg--c----c-t


    > pynast -i data.txt -t template.txt -l 25
    /Library/Python/2.6/site-packages/cogent/evolve/likelihood_tree.py:6: UserWarning: Not using MPI as mpi4py not found
    from cogent.util.parallel import MPI


    There's a warning about not having code for parallel processing. And here's the alignment:


    >0 A 1..41
    GAGTTT-GA--T-CC-T-G-GCTC-AG-AT-TGAA-C-GC--TGG-C--G-GT-A-TG--C----T-T
    >1 B 1..40
    -AGTTT-GA--T-CC-T-G-GCTC-AG-AT-TGAA-C-GC--TGG-C--G-GT-A-TG--C----T-T
    >2 C 1..38
    ---GAG-GA--T-CC-T-G-GCTC-AG-AT-TGAA-C-GC--TGG-C--G-GT-A-TG--C----T-T
    >3 D 1..40
    -CCGAG-GA--T-CC-T-G-GCTC-AG-AT-TGAA-C-GC--TGG-C--G-GT-A-TG--C----T-T


    One of the things that's been overlooked in the present exploration is the crucial contribution of another Robert Edgar program, uclust. That's used both for MSA and at least one other step in the QIIME pipeline. I need to read the paper and we'll look at it another day.

    Sunday, February 20, 2011

    Qiime (3) Heatmap


    This example should really be part of the previous post (here), about the first segment of the overview tutorial for Qiime (here). One script in Qiime makes a heatmap, and it is quite something. To do this example, I modified #7 from last time to save otu_table.txt in a sub-directory rather than write to the screen. The second command makes the heat map.

    Here are the commands:


    make_otu_table.py -i otus/seqs_otus.txt -t tax/reps_tax_assignments.txt -o figs/otu_table.txt

    make_otu_heatmap_html.py -i figs/otu_table.txt -o figs


    The first thing is that the output is html and can be displayed in the browser (great idea). The second is that it's quite complicated, with more than 5000 lines of javascript required for display. It allows drag and drop of the table rows, and custom mapping files to control the sorted order of the table rows. There are "tool tips" to display detail for each cell.

    The primary author, Jesse Stombaugh, and also the library authors Erik Bosrup (overLIB) and John Resig (jQuery) obviously put a huge amount of effort into this.

    I am not sure why the default output from this example (by Taxonomy) looks so weird. Anybody know why there are so many duplicate row names?

    I would probably make the red used for the highest counts a brighter color.

    Put this on the list for more investigation.


    Qiime (2)


    I'm continuing with the QIIME overview tutorial (project link, tutorial link, first post here).

    These scripts were all installed in a directory which is on my $PATH, they have the executable permission set, and they all have the shebang thing so they can be run using the script name only. Extensive help is available by running with -h only. Many more options are usually available. There is also extensive online help. An index page for all the scripts is here.

    I renamed the example data files, which were originally Fasting_Example.*, to data.*, where * is 'fna' or 'qual' just to make them shorter, except the map file (mapping barcodes and primers to samples) is map.txt.

    The zeroth step is to organize the sequences by sample, using the bar code. This identifier is the first few nt (here n=12), followed immediately by the primer (both are removed).

    Step 0: split_libraries.py


    required options:
    -f sequence filename
    -m map filename
    -q quality scores filename
    -o output sub-directory (will be created)

    some default options:
    -l MAX_SEQ_LEN [default:200]
    -s MIN_QUAL_SCORE [default:25]
    -M MAX_PRIMER_MM [default:0]

    command:
    split_libraries.py -f data.fna -m map.txt -q data.qual -o split


    According to the log file in split/ we have 1333 sequences split among 9 samples, after filtering out 6 sequences for one of: >1 primer mismatch, > 0 ambiguous bases, quality score < 25. The sequences are in seqs.fna.

    Step 1: pick_otus.py


    required options:
    -i input filename

    some default options:
    -m uclust
    -c CLUSTERING_ALGORITHM [default:furthest] # for mothur
    -s similarity [default:0.97]

    command:
    pick_otus.py -i split/seqs.fna -m uclust -s 0.97 -o otus


    According to the log file in otus/ we have 417 otus (at 97% identity). These are in seqs_otus.txt identified by the names assigned in step 0.

    Step 2: pick_rep_set.py

    Pick representative sequences for each otu, to be used for taxonomy assignment and sequence alignment. There's no point in assigning or aligning a large number of essentially identical sequences (and would be impossible with a realistic data set).


    required options:
    -i input filename (otu mapping file from #1)
    -f sequence filename
    -m most_abundant

    some default options:
    -s SORT_BY [default: otu]

    command:
    pick_rep_set.py -f split/seqs.fna -i otus/seqs_otus.txt -m most_abundant -o otus/reps.txt


    Step 3: align_seqs.py

    Align representative otus using MUSCLE (for example) or PyNAST. PyNAST requires a template alignment, which for the time being I will just put into the qiime_tutorial directory, in gg/core.txt (gg stands for Greengenes).


    required options:
    -i input filename (representative FASTA seqs from #2)

    some default options:
    -m ALIGNMENT_METHOD [default: pynast]
    -a PAIRWISE_ALIGNMENT_METHOD [default: uclust]
    -d BLAST_DB [set using environment variable]
    -t TEMPLATE_FP

    command:
    align_seqs.py -i otus/reps.txt -m pynast -t gg/core.txt -o aln


    The output alignment is in aln/reps_aligned.txt. Here is the strangely sparse Greengenes type of alignment. You could use MUSCLE, but it takes a while.. Although for this relatively small example, it was just a few minutes.


    command:
    align_seqs.py -i otus/reps.txt -m muscle -o aln_muscle


    Step 4: assign_taxonomy.py

    Assign taxonomy using the RDP classifier.


    required options:
    -i input filename (representative FASTA seqs from #2)

    some default options:
    -m ASSIGNMENT_METHOD [default: rdp]
    -c CONFIDENCE [default: 0.8]

    command:
    assign_taxonomy.py -i otus/reps.txt -m rdp -o tax


    Step 5: filter_alignment.py

    The Greengenes method results in many columns having all gaps. These should be removed using the lanemask file we downloaded from them. (I don't really understand all this yet---it's my next project).


    required options:
    -i input filename (representative FASTA seqs from #2)

    some default options:
    -m LANE_MASK_FP [default: none]
    -g ALLOWED_GAP_FRAC [default: 0.999999]
    -t THRESHOLD [default: 3.0]

    command:
    filter_alignment.py -i aln/reps_aligned.txt -m gg/mask.txt -o aln2


    Step 6: make_phylogeny.py

    Just make a phylogenetic tree. Here, we use FastTree.


    required options:
    -i input filename (from filtered alignment, step 5)

    some default options:
    -t fasttree
    -r ROOT_METHOD [default: tree_method_default]

    command:
    make_phylogeny.py -i aln2/reps_aligned_pfiltered.fasta -o tree.tre


    Step 7: make_otu_table.py

    Does what it says


    required options:
    -i input filename (from picking otus, step 1)

    some default options:
    -t TAXONOMY_FNAME [default: none] (step 4)
    -e EXCLUDE_OTUS_FP (e.g. chimeras)
    -o OUTPUT_FP [default: otu_table.txt]

    command:
    make_otu_table.py -i otus/seqs_otus.txt -t tax/reps_tax_assignments.txt


    [UPDATE: -o default is actually to print to the screen]

    Of course, you can run the whole "workflow" at once with (docs link):


    pick_otus_through_otu_table.py


    But first, you need to make a few changes to the file custom_parameters.txt as described in the tutorial. It provides options for all of the scripts in the sequence.

    I also decided to download FigTree and try it out. The graphic at the top of the post is our tree output from step 6.

    There is so much more to explore here:

    we've just started with Qiime
    we need to understand how PyNAST works
    and how the RDP classifier works

    And it would be nice to color the tree by Phylum or sample, or .. even better---plot a heat map! That's for next time.

    Saturday, February 19, 2011

    QIIME (1)

    Yesterday and this morning, I've been working on installing QIIME and doing the tutorial. It stands for: Quantitative Insights into Microbial Ecology (link). It's yet another major software project out of Rob Knight's lab.

    I'd like to post on the issues/questions/answers I run into as I work through it. It'll also give me an opportunity to get back to Bioinformatics (e.g. multiple sequence alignments).

    The first thing is that they recommend you use a virtual machine (Virtual Box) and install the QIIME Virtual Box on it, which is a huge download that packages Ubuntu Linux with all of the QIIME dependencies, correctly configured. Sounds like a great idea.

    I started by trying this. I had to download overnight on my machine at work (> 2 GB), then buy a new thumb drive to bring the file home, since I don't have the recommended amount of memory for the VM (1 GB) on that machine. But I ran into trouble---basically much aggravation dealing with the different keys on Linux, but also the Virtual Box and extra work trying to figure out copy/paste, moving files over, etc. The killer was when the VM prompted for an administrator's password, and of course I don't have it. There shouldn't be one needed..

    [ After a search of the Forum the mystery word is revealed to be: qiime. I shoulda guessed it. ]

    So I decided instead to deal with the dependencies for QIIME. I got almost all of them (like 24 or so), but for the "default pipeline" you really don't need so many. Particularly if you already have PyCogent and matplotlib installed, as I do, I would recommend just going down the list. It's not difficult, and it's better to be in an environment where you're comfortable working.

    There was really no trouble configuring them (at least the essentials).

    #1: Python 2.6

    I have it, since I'm on OS X. I ran into a little trouble because (from playing with MacPorts) I still had /opt/local/bin on my path as changed in .bash_profile. The QIIME install checks this variable and modifies its scripts (the she-bang thing), so I had to fix that later on.

    #2: Numpy 1.3.0

    I have this too.


    >>> import numpy
    >>> print numpy.__version__
    1.3.0


    Not sure what the default OS X version is, but easy_install will fix you up quickly.

    #3: PyCogent

    Of course, this has its own dependencies. But we've been through that before (here, here, here).

    #4: MUSCLE

    This is not one of the primary dependencies, but it's an old friend. I upgraded to the latest and greatest version, but it caused an error in the QIIME tests. Luckily I still had muscle3.6_src around. As usual, I put it in ~/Software and do:


    ln -s ~/Software/muscle3.6_src/muscle ~/bin/muscle


    and I put ~/bin on my $PATH in .bash_profile:


    export PATH=$HOME/bin/:$PATH


    #5: MAFFT

    It's an installer. Piece of cake. Check it:


    > mafft


    #6 uclust

    See the QIIME install notes for this. This is the work of Robert Edgar (also the creator of MUSCLE), who is a talented programmer, but also a businessman. Hence, no source code, and no 64-bit for some things. But there's a download link on the QIIME site. The only problem is that Safari put a .txt extension on the download and I thought there was a problem, went off on a wild goose chase, and got a version that is not new enough. Enough said. Put it in ~/Software and link as usual


    > uclust
    uclust v1.2.21q


    #7 PyNAST

    (download)

    unpack and move to Software


    python setup.py install
    cd tests
    python all_tests.py


    After installing MUSCLE and MAFFT passes all tests except:


    AssertionError: Got (DnaSequence(ACGTACG... 23), DnaSequence(ACGTACG... 23)), but expected (DnaSequence(ACGTACG... 23), DnaSequence(ACGTACG... 23))


    That's pretty silly.

    #8 Greengenes files

    greengenes core set data file (fasta)
    greengenes alignment lanemask file (txt)


    Where to put them? I put them in qiime_tutorial, see below, but will eventually want them in Qiime somewhere.

    #9 FastTree

    fasttree 2.1.0 (src)


    gcc -Wall -O3 -finline-functions -funroll-loops -o FastTree -lm FastTree-2.1.0.c


    move to Software and link

    #10 Java

    I don't need to add the Java runtime. I got it from Apple a while ago (here):


    > java -version
    java version "1.6.0_22"
    Java(TM) SE Runtime Environment (build 1.6.0_22-b04-307-10M3261)
    Java HotSpot(TM) 64-Bit Server VM (build 17.1-b03-307, mixed mode)


    #11 RDP Classifier

    rdp_classifier-2.0.1 (src)

    in .bash_profile:


    export RDP_JAR_PATH=$HOME/Software/rdp_classifier/rdp_classifier-2.0.jar


    Check for mismatch between the name of the classifier file. What I actually got was named 2.0 not 2.0.1.

    #12 QIIME

    That's it for the default pipeline..


    svn co https://qiime.svn.sourceforge.net/svnroot/qiime/trunk


    I followed their advice and put the install scripts in a special place (but I wouldn't do that again).


    python setup.py install --install-scripts=~/bin/qiime/bin/
    cd tests
    python all_tests.py


    The problem with the special directory is you will need a .qiime_config file (see the docs)

    Make sure to put it in ~/.qiime_config.

    Also not needed yet but I'll list them here anyway:

    #13 BLAST

    blast-2.2.22

    We've done that one before. The BLASTMAT variable must point to the NCBI data directory. In .bash_profile:


    export BLASTMAT=$HOME/Software/blast-2.2.22/data


    #14 Infernal

    (download)


    ./configure
    make
    make check
    sudo make install


    #15 R

    Run R and do:


    install.packages('randomForest')


    I upgraded to R 2.12.1 from 2.10.0, but it has some issue. Trying to get the ape package from CRAN hangs the app. I backed off to 2.11.1 (see here).

    Still to come:

    10 more bits of software.

    But they're not needed for the first part of the tutorial, so we should just do that first. Oh..I also have Sphinx installed (from the PyCogent instructions), so the documentation got built. But I've just been working from the web version anyway. On to the fun stuff.

    Thursday, February 17, 2011

    Fifteen


    I've put up the files for the Fifteen puzzle I posted about the other day (here). This is an Xcode project (and includes a copy of the built application). It's on Dropbox (here).

    You can move tiles by clicking with the mouse or using the arrow keys (much faster).

    I have not solved the technical problem of eliminating unsolvable puzzles, but I've played a few times and have yet to run into one. Either my expectations are wrong or I'm just lucky. I'll try to work more on this some other time.

    Wednesday, February 16, 2011

    Strang's Linear Algebra: rotation & eigenvectors

    The rotation matrix R is a fairly basic matrix from linear algebra. When multiplied times a vector, it rotates the vector through the angle θ: We've seen it before (here).


    R = [ cos(θ)  -sin(θ) ]
    [ sin(θ)   cos(θ) ]


    In Strang section 6.2 (first challenge problem), we are asked to prove the reasonable supposition:


    R(θ)n = R(nθ)


    That is, n sequential applications of the R vector should give the same result as a single rotation through an angle of .

    To calculate Rn we'll need the eigenvalues and eigenvectors of R. The interest of this problem comes from consideration of the following question:

    what sort of vector could have the same direction after rotation by an arbitrary angle θ?

    Use the standard formula:


    det (A - λI) = 0
    
    [ cos(θ) - λ  -sin(θ)     ]
    [ sin(θ)       cos(θ) - λ ]
    
    [cos(θ) - λ]2 + sin2(θ) = 0
    λ2 - 2 λ cos(θ) + cos2(θ) + sin2(θ) = 0
    λ2 - 2 λ cos(θ) + 1 = 0


    We need the quadratic equation to find λ:


    [2 cos(θ) +/- sqrt[4 cos2(θ) - 4]  ] / 2
    [2 cos(θ) +/- 2 sqrt[cos2(θ) - 1]  ] / 2
    cos(θ) +/- sqrt[cos2(θ) - 1]
    cos(θ) +/- sqrt[-sin2(θ)]
    cos(θ) +/- i sin(θ)
    
    λ1 = cos(θ) + i sin(θ)
    λ2 = cos(θ) - i sin(θ)


    Strang gives the eigenvectors as


    x1 = (1,i)
    x2 = (i,1)


    However, I think this is a misprint since R x1 gives:


    [ cos(θ)  -sin(θ) ] [ 1 ]   =    [ cos(θ) - i sin(θ) ]
    [ sin(θ)   cos(θ) ] [ i ]        [ sin(θ) + i cos(θ) ]


    but


    λ1 x1 = cos(θ) + i sin(θ)  [ 1 ]
    [ i ]
    
    =  [   cos(θ) + i sin(θ) ]
    [ - sin(θ) + i cos(θ) ]


    We could solve this:


    (A - λI1) x1 = 0
    (A - λI2) x2 = 0
    
    For x1
    
    [ -i sin(θ)     -sin(θ) ] [ ? ]   =    [ 0 ]
    [    sin(θ)   -i sin(θ) ] [ ? ]        [ 0 ]


    Without writing it out, it looks like we just need to try a change of sign:


    x1 = (-1,i)
    A x1 = λ1 x1
    
    [ cos(θ)  -sin(θ) ] [ -1 ] = [ - cos(θ) - i sin(θ) ]
    [ sin(θ)   cos(θ) ] [  i ]   [ - sin(θ) + i cos(θ) ]


    and λ1 x1 gives the same result:


    λ1 x1 = cos(θ) + i sin(θ)  [ -1 ]   = [ - cos(θ) - i sin(θ) ]
    [  i ]     [ - sin(θ) + i cos(θ) ]


    Similarly, x2 should be (i,-1) because R x2 equals:


    [ cos(θ)  -sin(θ) ] [  i ] = [   sin(θ) + i cos(θ) ]
    [ sin(θ)   cos(θ) ] [ -1 ]   [ - cos(θ) + i sin(θ) ]


    and


    λ2 x2 = cos(θ) - i sin(θ)  [  i ]
    [ -1 ]
    
    = [   sin(θ) + i cos(θ) ]
    [ - cos(θ) + i sin(θ) ]


    Everything checks.

    Now that we have the eigenvalues and eigenvectors, we need to diagonalize R. We construct the columns of S directly from the eiegenvectors:


    S =  [ -1   i  ]
    [  i  -1  ]


    Λ is just


    [  λ1  0  ]
    [  0   λ2 ]


    To get S-1 let's try the trick for 2 x 2's:


    S-1 =  1/2 [  -1  -i ]
    [  -i  -1 ]


    and multipy to confirm we do get I:


    1/2 [  -1  -i ]
    [  -i  -1 ]
    
    [ -1   i  ]    [   1   0 ]
    [  i  -1  ]    [   0   1 ]


    Let's also confirm that S Λ S-1 = R. Part one is:


    [  cos(θ) + i sin(θ)             0         ]
    [       0                cos(θ) - i sin(θ) ]
    
    [ -1   i  ]   [ -cos(θ) - i sin(θ)     sin(θ) + i cos(θ) ]
    [  i  -1  ]   [ -sin(θ) + i cos(θ)    -cos(θ) + i sin(θ) ]
    

    Step 2:

    1/2 [  -1  -i ]
    [  -i  -1 ]
    
    [ -cos(θ) - i sin(θ)     sin(θ) + i cos(θ) ]    [  a  b ]
    [ -sin(θ) + i cos(θ)    -cos(θ) + i sin(θ) ]    [  c  d ]
    
    a = 1/2 [   cos(θ) + i sin(θ) - i sin(θ) +   cos(θ) ] =  cos(θ)
    b = 1/2 [ i cos(θ) -   sin(θ) -   sin(θ) - i cos(θ) ] = -sin(θ)
    c = 1/2 [   sin(θ) - i cos(θ) + i cos(θ) +   sin(θ) ] =  sin(θ)
    d = 1/2 [ i sin(θ) +   cos(θ) +   cos(θ) - i sin(θ) ] =  cos(θ)


    And it checks.

    To do the exponentiation we just need to calculate Λn. So what is:


    λ1n = [ cos(θ) + i sin(θ) ]n
    λ2n = [ cos(θ) - i sin(θ) ]n


    Strang drops another hint by reminding us of Euler's formula:


    e = cos(θ) + i sin(θ)
    (e)n = einθ


    which is the whole point! But what about:


    λ2n = [ cos(θ) - i sin(θ) ]n


    If we compare -θ with θ then:


    cos(-θ) =  cos(θ)
    sin(-θ) = -sin(θ)
    cos(θ) - i sin(θ) = cos(-θ) + i sin(-θ) = e-iθ
    (e-i&theta)n = e-in&theta


    Now all we have to do is convert back to sine and cosine:


    λ1n = cos(nθ) + i sin(nθ)
    λ2n = cos(nθ) - i sin(nθ)


    The big computation we did above (to check that S Λ S-1 = R, is exactly the same with the substitution of nθ for θ.


    R(θ)n = 
    
    [ cos(nθ)  -sin(nθ) ]
    [ sin(nθ)   cos(nθ) ]


    We're done!

    Tuesday, February 15, 2011

    A permutations puzzle


    wikimedia

    I wrote a very simple game in PyObjC---it's a "fifteen" puzzle. The goal of the game is to get all 15 tiles in order with the empty space in the lower right hand corner. This can be viewed as the permutation:


    1, 2, 3 .. 13, 14, 15, 0


    I had a vague recollection that some such puzzles are unsolvable, and it's fairly easy to see by just playing that one cannot achieve this order using the standard layout:


    1, 2, 3 .. 13, 15, 14, 0


    And conversely, if you were presented with the modified layout, the puzzle would not be solvable. Since it seems really important not to give the user an unsolvable puzzle, I looked into it some more and found that permutations (which is what this problem is about) have parity.

    Suppose we take the following permutation of 1..5:


    3  4  5  2  1


    How many swaps (u,v = v,u) does it take to put the numbers into ascending order? This sequence of three works:


    (13)(35)(24)


    So we can think of this permutation of the sequence as having an odd parity. One question I don't know the answer to is how you would prove that there does not exist some longer sequence of swaps that also reaches the "correct" order, but has even parity. Probably, if I studied the article it is explained there.

    A second measure I saw for parity is to take each member of the sequence in turn and compare it with all the members at a higher index:


    for i in range(len(L)-1):
    for j in range(i,len(L)):
    if L[i] > L[j]:
    count += 1


    We count +1 if the ith element is out of (ascending) order with respect to the jth element, and define the total count of such mismatched pairs as a different measure of parity.

    This is the output from such an analysis on all permutations of the sequence 0, 1, 2, 3, showing the permutation, then the results of the swap test, followed by the order test:


    0 1 2 3     0  0
    0 1 3 2 1 1
    0 2 1 3 1 1
    0 2 3 1 2 2
    0 3 1 2 2 2
    0 3 2 1 1 3
    1 0 2 3 1 1
    1 0 3 2 2 2
    1 2 0 3 2 2
    1 2 3 0 3 3
    1 3 0 2 3 3
    1 3 2 0 2 4
    2 0 1 3 2 2
    2 0 3 1 3 3
    2 1 0 3 1 3
    2 1 3 0 2 4
    2 3 0 1 2 4
    2 3 1 0 3 5
    3 0 1 2 3 3
    3 0 2 1 2 4
    3 1 0 2 2 4
    3 1 2 0 1 5
    3 2 0 1 3 5
    3 2 1 0 2 6


    The number of swaps required to achieve sorted order is never more than 3, while the reverse order has a maximum of 6 comparisons giving an incorrect order. I notice that these two measures seem to be either both odd or both even, and confirmed that result by testing all permutations of range(10) and random samples from range(25).

    Looking ahead, the idea will be that the moves in the puzzle, and particularly those which really matter (vertical ones), don't change the parity, but so far I am not getting the expected answer with that.


    from itertools import permutations as perms
    import random

    def format(pL):
    m = len(str(max(pL)))
    pL = [str(n).rjust(m) for n in pL]
    return ' '.join(pL)

    def swaps_to_sort(L,refL=None,verbose=False):
    if not refL:
    refL = sorted(L)
    count = 0
    for i in range(len(L)-1):
    u = L[i]
    v = refL[i]
    if verbose:
    print 'check:', u,
    if u == v:
    if verbose: print
    continue
    count += 1
    j = L.index(v)
    if verbose:
    print 'switch ', ':', u, v
    L[i],L[j] = L[j],L[i]
    if verbose:
    list_print(L)
    return count

    def out_of_order(L):
    count = 0
    for i,c1 in enumerate(L):
    for c2 in L[i+1:]:
    if c1 > c2: count += 1
    return count

    def test1(n):
    L = perms(range(n))
    for p in L:
    pL = list(p)
    s = swaps_to_sort(pL[:])
    o = out_of_order(pL)
    print '%s %s %s' % (format(p), s, o)
    assert s % 2 == o % 2

    def test2():
    pL = range(25)
    for i in range(100):
    random.shuffle(pL)
    print format(pL)
    s = swaps_to_sort(pL[:])
    o = out_of_order(pL)
    assert s % 2 == o % 2

    test1(4)
    #test2()

    Sunday, February 13, 2011

    The slope of the sine curve

    Just to finish with the subject from last time (here), let's show that the slope of the sine curve at x is cos(x) and for the cosine curve at x it is -sin(x).

    We start from x, and then move a little bit h. Using the rule for sum of sines (here):


    sin(x + h) = sin(x) cos(h) + cos(x) sin(h)

    f(x + h) - f(x) =
    = sin(x) cos(h) + cos(x) sin(h) - sin(x)

    d/dx sin(x) = lim(h -> 0) [f(x + h) - f(x)]/h
    = 1/h [sin(x) cos(h) + cos(x) sin(h) - sin(x)]
    = -(1/h) sin(x) (1 - cos(h)) + (1/h) cos(x) sin(h)


    The first term is -sin(x) times (1/h)(1 - cos(h)); last time we showed that (1/h)(1 - cos(h)) equals zero in the limit as h -> 0.

    The second term is cos(x) times (1/h) sin(h); we showed that (1/h) sin(h) approaches 1 as h -> 0. Thus,


    d/dx sin(x) = cos(x)


    Since sine and cosine are periodic with cosine "ahead"


    sin(x + π/2) =  cos(x)
    cos(x + π/2) = -sin(x)


    If


    y = cos(x) =
    = sin(x + π/2)


    Let


    u = x + π/2


    Then


    d/dx cos(x) = 
    = d/dx sin(x + π/2)
    = d/du sin(u) d/dx (x + π/2)
    = d/du sin(u)
    = cos(u)
    = cos(x + π/2)
    = -sin(x)

    d/dx cos(x) = -sin(x)

    Know your limits

    To find the derivative of the sine function, we need to determine two limits. The first is:


    lim (h -> 0) sin(h)/h


    In the figure, h is the measure of the angle and also the length of the arc of the circle between A and D (in radians). (I'm using h instead of x because ultimately this will be a small change to x, as in x + h).


    Kline sets up this inequality:


    area OAB < area OAD < area OED

    area OAB = (1/2) OB AB
    = (1/2) cos(h) sin(h)

    area OAD = h/(2π) π 12
    = (1/2) h

    area OED = (1/2) OD ED
    = (1/2) sin(h)/cos(h)


    The last result follows since OAB and OED are similar triangles so that ED/OD = AB/OB, and OD = 1. Thus, the inequality becomes:


    (1/2) cos(h) sin(h) < (1/2) h < (1/2) sin(h)/cos(h)


    As long as we do not actually reach h = 0, we are allowed to divide by sin(h):


    cos(h) < h/sin(h) < 1/cos(h)


    As h approaches 0, cos(h) and its inverse 1/cos(h) both approach 1 so the ratios h/sin(h) and sin(h)/h both approach 1 as well.

    Strang does the first part by extending the segment AB (dotted line) and noting that


    2 AB < 2 h
    2 sin(h) < 2h
    sin(h)/h < 1


    The other thing we need is:


    lim (h -> 0) (1 - cos(h))/h


    Following Strang:


    sin2(h) + cos2(h) = 1
    sin2(h) = 1 - cos2(h)
    = (1 + cos(h)) (1 - cos(h))


    Since sin(h) < h (see the figure again):


    (1 + cos(h)) (1 - cos(h)) = sin2(h) < h2


    Divide by h and also by 1 + cos(h):


    (1 - cos(h))/h < h/(1 + cos(h))


    Strang says, note that all terms are positive, so that:


    0 < (1 - cos(h))/h < h/(1 + cos(h))


    Now, as as h -> 0 the right side must go to 0/2 (that is, 0) and our ratio is "caught in the middle."

    Here is a simple Python script to calculate the same values. Notice that although 1-cos(h) and h are both approaching 0, h is approaching more slowly, so the ratio tends to the 0 in the limit. First the output:


    h 1.0000000000, sin(h) 0.8414709848, h/sin(h) 0.8414709848
    h 0.5000000000, sin(h) 0.4794255386, h/sin(h) 0.9588510772
    h 0.1666666667, sin(h) 0.1658961327, h/sin(h) 0.9953767962
    h 0.0416666667, sin(h) 0.0416546114, h/sin(h) 0.9997106733
    h 0.0083333333, sin(h) 0.0083332369, h/sin(h) 0.9999884260
    h 0.0013888889, sin(h) 0.0013888884, h/sin(h) 0.9999996785
    h 0.0001984127, sin(h) 0.0001984127, h/sin(h) 0.9999999934
    h 0.0000248016, sin(h) 0.0000248016, h/sin(h) 0.9999999999
    h 0.0000027557, sin(h) 0.0000027557, h/sin(h) 1.0000000000

    h 1.0000000000, cos(h) 0.5403023059, (1-cos(h))/h 0.4596976941
    h 0.5000000000, cos(h) 0.8775825619, (1-cos(h))/h 0.2448348762
    h 0.1666666667, cos(h) 0.9861432316, (1-cos(h))/h 0.0831406106
    h 0.0416666667, cos(h) 0.9991320700, (1-cos(h))/h 0.0208303194
    h 0.0083333333, cos(h) 0.9999652780, (1-cos(h))/h 0.0041666426
    h 0.0013888889, cos(h) 0.9999990355, (1-cos(h))/h 0.0006944443
    h 0.0001984127, cos(h) 0.9999999803, (1-cos(h))/h 0.0000992063
    h 0.0000248016, cos(h) 0.9999999997, (1-cos(h))/h 0.0000124008
    h 0.0000027557, cos(h) 1.0000000000, (1-cos(h))/h 0.0000013779
    h 0.0000002756, cos(h) 1.0000000000, (1-cos(h))/h 0.0000001378
    h 0.0000000251, cos(h) 1.0000000000, (1-cos(h))/h 0.0000000133
    h 0.0000000021, cos(h) 1.0000000000, (1-cos(h))/h 0.0000000000
    h 0.0000000002, cos(h) 1.0000000000, (1-cos(h))/h 0.0000000000
    h 0.0000000000, cos(h) 1.0000000000, (1-cos(h))/h 0.0000000000


    and the listing:


    from __future__ import division
    from math import sin, cos

    h = 1
    for i in range(1,10):
    h /= i
    y = sin(h)
    print 'h %3.10f, sin(h) %3.10f, h/sin(h) %3.10f' % (h, y, y/h)

    print
    h = 1
    for i in range(1,15):
    h /= i
    y = cos(h)
    print 'h %3.10f, cos(h) %3.10f, (1-cos(h))/h %3.10f' % (h, y, (1-y)/h)

    Thursday, February 10, 2011

    A plot of the quadratic in Python


    I have another simple matplotlib example, based on the parabola post from the other day (here). The conclusion from that post was that any function:


    y(x) = ax2 + bx + c


    can be manipulated to the form:


    y - y0 = a(x - x0)2


    That is, the parabola is just y = a(x)2 translated to have a different vertex. I didn't do a systematic examination or anything, but here is one example in Python.

    The function quadratic takes arguments a, b, and c and returns the vertex (x0, y0) as well as a numpy array containing x such that |x - x0| <= 4, and a second one containing f(x) for each value of x.

    We plot two sets of three parabolas, each set has one for each of a = 1, 2 and 3. One set is at the origin (cyan, blue and purple). The second set (magenta, salmon and red) has c = 3 and:


    a = 1;  b = 2
    a = 2; b = 4
    a = 3; b = 6


    Since x0 = -b/2a is the same for each parabola in the second set, they all have the same axis of symmetry. The only difference (besides the shape parameter a) is y0, which can be calculated either from plugging a, b, c and x0 into the standard form, or by using the fact that


    y0 = b2/4a - b2/2a + c
    = -b2/4a + c


    Using the second method, I get:


    a = 1;  b = 2;  y0 = -1 + 3 = 2
    a = 2; b = 4; y0 = -2 + 3 = 1
    a = 3; b = 6; y0 = -3 + 3 = 0


    We ought to be able to solve for b and c to put the parabola anywhere on the x,y-plane..

    UPDATE:


    x0 = -b/2a
    b = -2ax0

    y0 = -b2/4a + c
    c = y0 + b2/4a
    = y0 + ax02

    check:

    y = ax2 + bx + c
    = ax2 -2ax0x + y0 + ax02
    y - y0 = a(x2 -2x0x + x02)
    = a(x - x0)2


    from __future__ import division
    import matplotlib.pyplot as plt
    import numpy as np

    def func(a,b,c):
    @np.vectorize
    def f(x):
    return a*x**2 + b*x + c
    return f

    def quadratic(a,b=0,c=0):
    f = func(a,b,c)
    x0 = -b/(2*a)
    X = np.arange(x0-4,x0+4,0.01)
    return x0,f(x0),X,f(X)

    blues = ['cyan', 'blue', 'purple']
    reds = ['magenta', 'salmon', 'red']

    for i,(a,b) in enumerate(zip((1,2,3),(2,4,6))):
    x0,y0,X,Y = quadratic(a,b,c=3)
    c = reds[i]
    plt.scatter(X,Y,s=2,color=c)
    plt.scatter(x0,y0,s=100,color=c)
    print 'x0',x0,'y0',y0

    x0,y0,X,Y = quadratic(a)
    c = blues[i]
    plt.scatter(X,Y,s=2,color=c)
    plt.scatter(x0,y0,s=100,color='k')

    ax = plt.axes()
    ax.set_xlim(-3,3)
    ax.set_ylim(-1,5)
    plt.grid(True)
    plt.savefig('example.png')