Wednesday, July 22, 2009

Phylogenetic Trees: getting started

I want to do some posts about making phylogenetic trees. We'll start with an example using bacterial 16S rRNA gene sequences. The species come from the class Gammaproteobacteria, with one from the Betaproteobacteria as an "outgroup" (Kingella oralis). Use of an outgroup allows us to root the tree.

The species are:

Salmonella typhi (sequence)
Escherichia coli (sequence)
Pseudomonas aeruginosa (sequence)
Haemophilus parainfluenzae (sequence)
Stenotrophomonas maltophilia (sequence)
Kingella oralis (sequence)

If you want to do this yourself, navigate to the NCBI page that has all the completed bacterial chromosome sequences, and then click on the entry for each species in the column with the header RNAs, then you can select a 16S rRNA sequence in FASTA format for each species. To make this easier, I have linked to the FASTA pages above. Two organisms have not been sequenced completely (Haemophilus and Kingella). Just copy and paste all the sequences including the title line to a text file.

The lengthy FASTA title lines are a small problem.


> gi|49175990:4164682-4166223 Escherichia coli str. K-12 substr. MG1655, complete genome
AAATTGAAGA...


Some programs don't allow long titles or have other restrictions on names. For my work I often use the Genbank ID as the title. Here we'll shorten these to genus and species:

Escherichia_coli


Load the sequences into Clustal, do the alignment, and ask it to draw a tree.


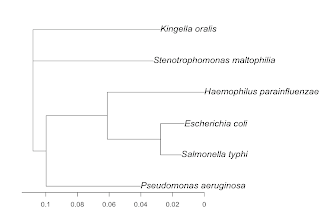
Here is what I got:

(
(
Stenotrophomonas_maltophilia:0.07574,
Kingella_oralis:0.08026)
:0.00827,
Pseudomonas_aeruginosa:0.05950,
(
(
Salmonella_typhi:0.01297,
Escherichia_coli:0.01491)
:0.03356,
Haemophilus_parainfluenzae:0.06113)
:0.03863);


I can draw this tree using R and the APE package.

library(ape)
setwd('Desktop')
tree = read.tree('seq.ph')


> tree

Phylogenetic tree with 6 tips and 4 internal nodes.

Tip labels:
[1] "Stenotrophomonas_maltophilia"
[2] "Kingella_oralis"
[3] "Pseudomonas_aeruginosa"
[4] "Salmonella_typhi"
[5] "Escherichia_coli"
[6] "Haemophilus_parainfluenzae"

Unrooted; includes branch lengths.


plot(root(tree,2),cex=1.3)
axisPhylo()


Here it is: