The Newick format is commonly used for trees. For example: (A:0.1,B:0.2,(C:0.3,D:0.4):0.5);
Some examples have the internal nodes named, but the default output I started with from R's 'ape' package does not. So, keeping things simple to begin with, my code only handles trees with unlabeled internal nodes. (We assign those nodes labels of our own internally). It does allow trees which are not strictly bifurcating, like the above sample.
I'll use as an example of some rRNA sequences for species in the genus Campylobacter. The tree as written to a text file looks like this:
(ATCCBAA-381:0.03654844585,(((((L04322.1:0.0007711714468,L06977.1:0.001632679337):0.004503354114,
DQ087191.1:0.005977482141):0.009591658445,L04313.1:0.01628156841):0.003053993324,RM1221:
0.05317691099):0.00527415189,(L06975.1:0.0007282093916,L06974.1:7.179077908e-05):0.02100563578):
0.006031674847,(((DQ174168.1:0,L04320.1:0):0.001540638157,AM420221.1:
0.0008632126266):0.01623349904,AY005038.1:0.01750604341):0.002187441243);
Here is the output from R for a plot, where I have substituted standard species names for the Genbank IDs:

I'll try to show in future posts how my code works. (You might download it and try it on this sample tree). In outline we:
• capture the titles and substitute simple labels
• parse the structure of individual nodes
• walk the tree and measure distances from each node to the next and the root
• save the information to a text file with fields:
- label
- distance to root
- distance from bottom of plot
- distance to next node
- y coordinate of first subnode (for internal nodes)
- y coordinate of last subnode (ditto)

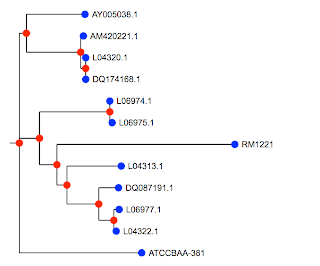
Above is the image produced by my Cocoa application that does the plotting (though one could certainly write R code to do it using the information we saved). This basic set of programs works. One thing I need to do now is much more extensive testing (boring). Also, it would be nice to have some shiny GUI elements. Imagine a joystick to move labels around, or being able to select subtrees for manipulation (like coloring).
The tree is the same as the first one. You would be able to see it more easily if we were using the species names, but I haven't done that part yet. Some nodes have been rotated, but that's legal. The only other difference is a new OTU (operational taxonomic unit) or species (labeled L) that I added to my database since I made the first figure a few weeks ago.